-
Book Overview & Buying
-
Table Of Contents
Financial Modeling and Reporting with Microsoft Power BI
By :
Power BI has been good to us. Tom, Shailan, and I (Andy) have carved out successful and enjoyable careers and for the past 10 years, Power BI has been a large part of that. We all had the good fortune, or maybe good luck, to start riding the Power BI wave early, working with the product as it evolved and developed. To support this, we all work with many datasources and business systems across a broad range of clients and industries. To say no two days are alike is an understatement.
Tom's roots are as a SQL database admin and Shailan and I worked with ERP providers (Navision and SAP), then Microsoft.
Now, we all ply our trade as consultants in the UK and USA and a large part of that is working with Power BI and finance data. You know why we work with Power BI, but why do we work with so much finance data? Well, most of the use of Power BI is in the financial arena so if you're going to dedicate yourself to this product, you'll inevitably spend a reasonable proportion of your time working with financial data.
The intersection of the worlds of Power BI and finance means this book has scratched an itch for the three of us. That is, to write a book dedicated to Power BI from the perspective of the finance user. We've seen every experience of finance users starting to use this tool and we've all had a long desire to write the handbook that could get them up to speed quicker.
Most Power BI books are written for developers, not users – which I hasten to add, isn't a criticism. We own many of those books and are friends with some of the authors. The Power BI and data community is a relatively small and definitely friendly group and we all intend to be part of this for much longer. We wanted to add something to the large volume of Power BI books that does something slightly different.
That's a few words on us and how we got here, so let's move on to the reason you're here, which is the book.
This is mainly a technical book and we know from our own use of technical books, they're rarely read in a linear fashion. We don't expect too many people to start with Chapter 1 then work through to the end of Chapter 13, page after page. If you want to, that's great, and we've written it so anyone can do exactly that, but we've also worked hard to make chapters reasonably self-contained. For example, if you need to pick up the book to help you with your budgeting processes, please go straight to Chapter 7. You don't have to read chapters 1 to 6 first, but you can. There may even be chapters or sections that don't support your work. Finance is a broad topic so we had to make some difficult decisions about content from the outset. Put succinctly, please use the resource to support your requirements.
At the start of the book, the examples are rudimentary and we have step-by-step guides. But, we pick up the pace quickly as the book progresses, so we had to assume you have some training in Power BI and Power Query. If you're coming to the book cold, we recommend taking some structured Power BI training, even if it's binge watching YouTube videos. There are so many great books, videos, in-person, and online courses that we didn't want to replicate, so we can focus these pages on the intersection of Power BI and finance.
From the outset we wanted to use examples the reader could follow. So, we gave ourselves the extra task of building a demonstration dataset. Credit where credit's due, Tom built the dataset and did an amazing job to build an imaginary entity called Clearly Clothing that you see in these pages. Building a dataset is not a quick and simple task and many weekends were spent working on this.
We have to store this data somewhere our readers can easily find it and we chose GitHub. As finance users, GitHub may be new so a quick explanation for GitHub is it's Microsoft's online platform for developers to store and manage code. We use it in a pretty rudimentary way, as a file share to store the Power BI and source Excel files we use for the examples in the book. More on this later.
That's a little about us, why we did this and how we designed the book. From here we hope this book helps you to develop your Power BI skills and maybe solves a few challenges you had in using Power BI.
-Andy Clark
This book is for finance professionals, accountants, financial analysts, and BI developers who want to leverage Power BI to improve, automate, and future-proof their financial reporting. Whether consolidating data from ERPs, building reports across entities, or exploring advanced Power BI features, this book equips readers with practical skills and strategic insight.
Chapter 1, Identifying Your Reporting Needs and Data Sources
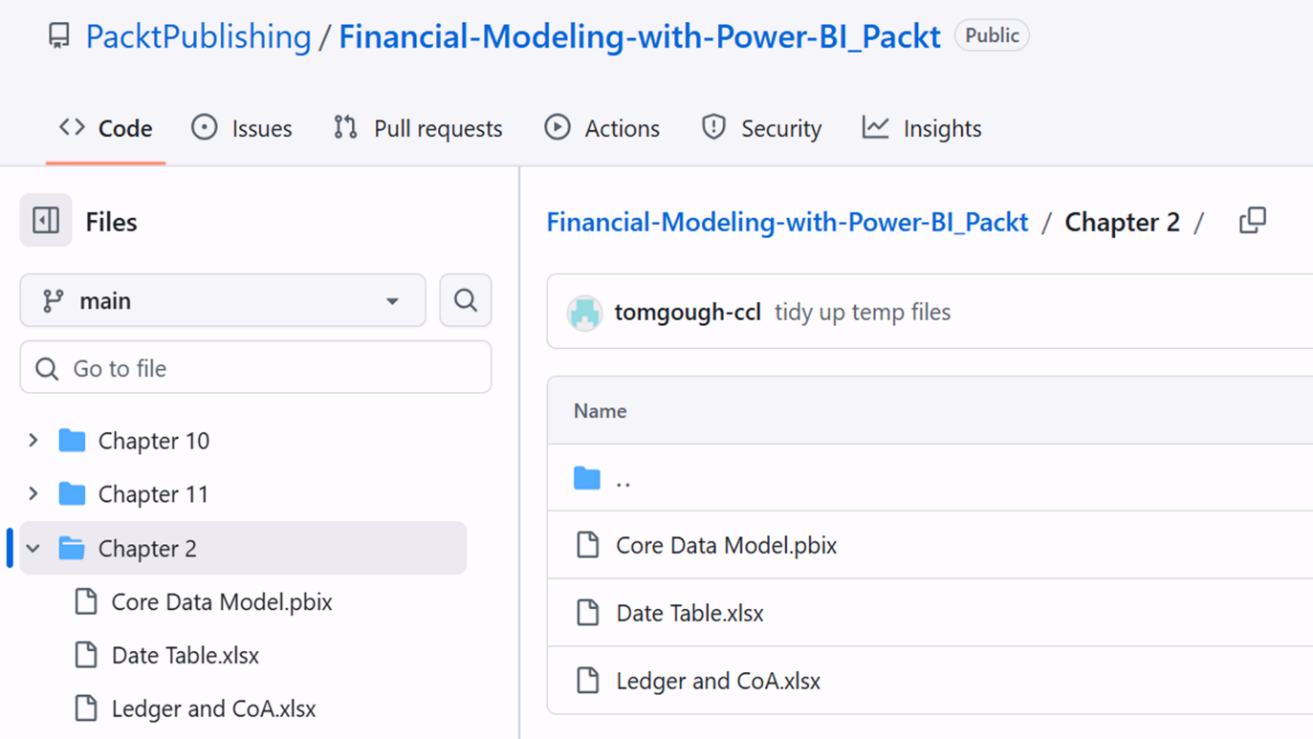
, provides an introduction and overview of what you need to consider when embarking on a Power BI project and how to identify specific needs.
Chapter 2, The Basic Model for Financial Reporting, introduces the basic concepts for creating a data model for financial reporting.
Chapter 3, Creating a Trial Balance and Income Statement, shows how to create two of the most basic and fundamental reports in any financial suite – the Trial Balance and Income Statement. This chapter introduces some basic DAX and data visualization techniques.
Chapter 4, Common DAX Measures, expands on the use of DAX to more complex measures. It introduces the ideas of time intelligence and some considerations for handling foreign exchange calculations.
Chapter 5, Handling Manual Journal Entries, introduces some more advanced data modeling techniques such as the snowflake schema and role-playing dimensions. While this chapter uses manual journal entries as an example, the concept is applicable beyond this.
Chapter 6, Streamlining with Power Query, demonstrates how to manage data sizes and improve report performance by controlling what is being imported and helping to keep focus on what is important.
Chapter 7, Incorporating Budgets and Targets, shows how budgets and targets can be incorporated into the data model to measure performance. Here we also look at how to handle variations in the granularity of different data sets.
Chapter 8, Managing Inventory Data, expands on data modeling techniques to show additional context to the financial reporting suite and demonstrates how to deal with data that is very different in nature from the core financial data sets.
Chapter 9, Creating a Suite of Financial Reports, builds on the techniques demonstrated up to this point to build a more comprehensive set of financial reports, expanding beyond the basics to produce engaging visuals for a variety of reports across data sets.
Chapter 10, Testing and Fine-Tuning Your Data, addresses the issue of ensuring the accuracy of reports and non-functional testing to make sure that reports are both accurate and usable, and that the user base will continue to use the reports in the long term.
Chapter 11, Printable Financial Statements with Power BI Paginated, introduces Power BI Paginated for creating printable and other types of fixed-format reports.
Chapter 12, Financial Reporting in an AI-Driven World, provides an overview of the hottest topic of today – AI. This chapter covers how to use AI features in Power BI, when and why to use AI, and how to structure data to facilitate future use of AI.
Chapter 13, Evolving and Maintaining Your Reports, shows how to manage the reporting suite, from defining security, to capturing bugs, and new requirements, through to the end of the lifecycle of a report – its final retirement.
At the start of each chapter with examples, we have a link to the GitHub folder that stores the Power BI files for the chapter so you can download and follow along if you like. There are 2 components to make this work: the Power BI PBIX files and the Excel source data files. For most chapters, you'll only need the Power BI PBIX file. For Chapter 6, where we have tips and tricks for streamlining your data with Power Query, you'll also need the Excel files. And, if you want to freestyle a little and explore the data on your own, we recommend downloading the files and connecting the Power BI PBIX file to the Excel source data. To do this, please follow these steps:

Figure 0.1: GitHub repository

Figure 0.2: Download icon
For this example, in Chapter 2, you'll download 3 files:
Core Data Model.pbixDate Table.xlsxLedger and CoA.xlsxStore them somewhere on your PC. We usually create a folder to store all three files.

Figure 0.3: Storing files in a local folder
Core Data Model.pbix file. From the Home tab, click the dropdown chevron icon on Transform data and then select Data source settings. Quick warning: if you click the icon you'll open Power Query, so be sure to click on the bottom half of the icon.

Figure 0.4: Transform data option
When you click Data source settings, you'll see the following dialog box.

Figure 0.5: Data source settings window

Figure 0.6: Selecting the Excel Workbook
This opens the source for the data file. As you can see from our screen images, the Power BI file is set to Tom's PC, so unless you're using Tom's PC (which he may not be happy with), click Browse, locate the folder with the downloaded files on your PC and click on the Date Table.xlsx option, then click OK.
Repeat the process for the Ledger and CoA.xlsx files and your Power BI Desktop file will be connected to the Excel files on your PC. This means when you open Power Query (from the Transform Data button), you'll be able to use the tools within Power Query.
Within the examples, Tom builds various models that represent different business scenario's or concepts. At the start of each chapter that has examples there'll be a link to the model you need and the accompanying files will be in the same GitHub folder.
Of course, you may prefer to use your own data to practice the examples; just be aware the formulas may not match your data, so you'll need to amend them to work.
The code bundle for the book is hosted on GitHub at https://github.com/PacktPublishing/Financial-Modeling-with-Power-BI_Packt. We also have other code bundles from our rich catalog of books and videos available at https://github.com/PacktPublishing. Check them out!
We also provide a PDF file that has color images of the screenshots/diagrams used in this book. You can download it here:https://packt.link/gbp/9781835880265.
There are a number of text conventions used throughout this book.
CodeInText: Indicates code words in text, database table names, folder names, filenames, file extensions, pathnames, dummy URLs, user input, and Twitter handles. For example: "In Notepad, delete the text ['=Table.Unpivot(' from the start of the pasted text and '"Attribute", "Value")]' from the end of the pasted text."
A block of code is set as follows:
Opening Balance =
SUMX(
FILTER(
ALL('Calendar'[Full Date]),
'Calendar'[Full Date]< MIN('Calendar'[Full Date])
),
[Total Amount]
)
When we wish to draw your attention to a particular part of a code block, the relevant lines or items are set in bold:
Total Revenue = CALCULATE(
[Total amount],
FILTER(
'Chart of Account','Chart of Account'
[AccountCategory]="SALE" ||
'Chart of Account' [AccountCategory]="OTHER1NC"
)
)*-1
Bold: Indicates a new term, an important word, or words that you see on the screen. For instance, words in menus or dialog boxes appear in the text like this. For example: "Power Query is accessed from the Transform data button on the ribbon."
Warnings or important notes appear like this.
Tips and tricks appear like this.
Feedback from our readers is always welcome.
General feedback: If you have questions about any aspect of this book or have any general feedback, please email us at customercare@packt.com and mention the book's title in the subject of your message.
Errata: Although we have taken every care to ensure the accuracy of our content, mistakes do happen. If you have found a mistake in this book, we would be grateful if you reported this to us. Please visit http://www.packt.com/submit-errata, click Submit Errata, and fill in the form.
Piracy: If you come across any illegal copies of our works in any form on the internet, we would be grateful if you would provide us with the location address or website name. Please contact us at [email protected] with a link to the material.
If you are interested in becoming an author: If there is a topic that you have expertise in and you are interested in either writing or contributing to a book, please visit http://authors.packt.com/.
Change the font size
Change margin width
Change background colour