-
Book Overview & Buying
-
Table Of Contents
Mastering Windows Server 2025 - Fifth Edition
By :
Task Manager is a tool that has existed in all Windows operating systems since the first days of the graphical interface, but it has evolved quite a bit over the years. This tool is essential for troubleshooting problems happening inside Windows, and for terminating applications or processes that seem to be “stuck.” One of the goals of Windows Server 2025 is to be even more useful and reliable than any previous version of Windows Server has been. So, it only makes sense that we finally remove Task Manager altogether, since it simply won’t be needed anymore, right?
I’m kidding, of course! While Server 2025 will hopefully prove itself to indeed be the most stable and least needy operating system we have ever seen from Microsoft, Task Manager still exists and will still be needed by server administrators everywhere. If you haven’t taken a close look at Task Manager in a while, it has changed significantly over the past few releases. Now that we have adopted the Windows 11 GUI, along with it comes a brand-new Task Manager.
Task Manager is still typically invoked by either hitting Ctrl + Alt + Del on your keyboard and then clicking on Task Manager, or by right-clicking on the taskbar and then choosing Task Manager. You can also launch Task Manager with the key combination Ctrl + Shift + Esc or by typing taskmgr inside the Run or Search dialog boxes. If you have already worked with Windows Server 2022, you’ll notice a change right away. Previously, a miniature version of Task Manager was displayed by default—only a simple list of applications that were currently running. This was a useful interface for forcing an application to close that may be hung up, but not for much else, and my guess is that 99% of Task Manager launches were immediately followed by a click on the More details link. That miniature instance of Task Manager is gone, and launching Task Manager via any method will get you to the full toolset.
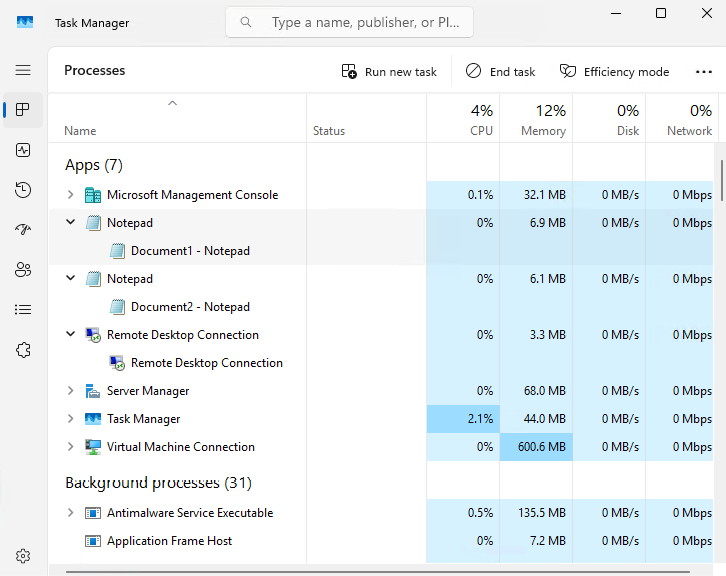
We immediately notice that the displayed information is more user-friendly than in previous years, with both Apps and Background processes being categorized in a more intuitive way and multiple instances of the same application being condensed down for easy viewing. This gives a faster overhead view of what is going on with our system, while still giving us the ability to expand each application or process to see what individual components or windows are running within the application, such as in Figure 1.18:

Figure 1.18: Task Manager: Processes
One of the greatest additions to this new Task Manager is the search bar on top! Never before has it been so easy to quickly narrow in on a problematic application or process, or to seek out specific information for your troubleshooting.
Make sure to check out the other sections available inside Task Manager as well, listed on the left-hand side. Users will show us a list of currently logged-in users and the amount of hardware resources that their user sessions are consuming. This is a nice way to identify on a Remote Desktop Session Host server, for example, an individual who might be causing a slowdown on the server. The Details tab is a little bit more of a traditional view of the Processes tab, splitting up much of the same information but in the older style that we were used to seeing in versions of the operating system long ago. Then, the Services tab is pretty self-explanatory; it shows you the Windows services currently installed on the server, their statuses, and offers the ability to start or stop these services as needed, without having to open the Services console separately. Startup apps is a quick way to see what applications are configured to start when the operating system starts, and you can easily enable or disable that from happening per application.
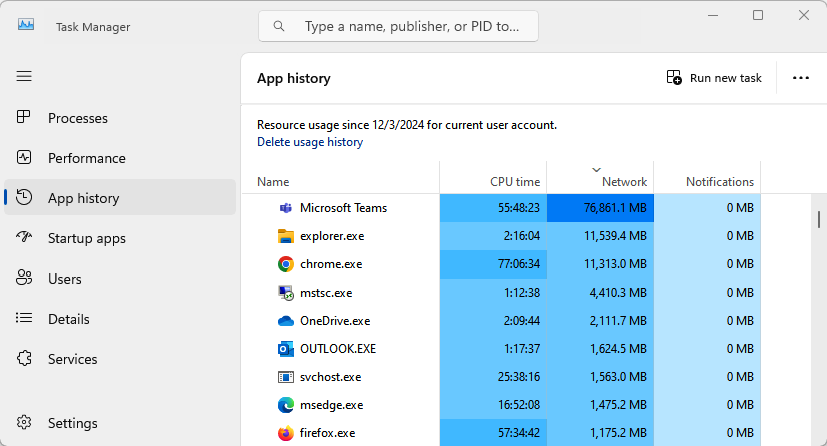
Anyone who has been using Windows 11 for a while may already have experience with another section of this new Task Manager, called App history. Previously, Task Manager was only focused on real-time data. While certainly useful for live troubleshooting and the fixing of problems that are happening right now, historical data is always part of troubleshooting methodology. We now have some historical data right here inside Task Manager! This instance of Windows Server 2025 that I am using has not been running for very long, and so the App history screen is quite boring at the moment. However, if I open the same window on my Windows 11 workstation that I have been using for a while, we’ll see a good representation of the useful information this tool is going to present.

Figure 1.19: Task Manager: App history
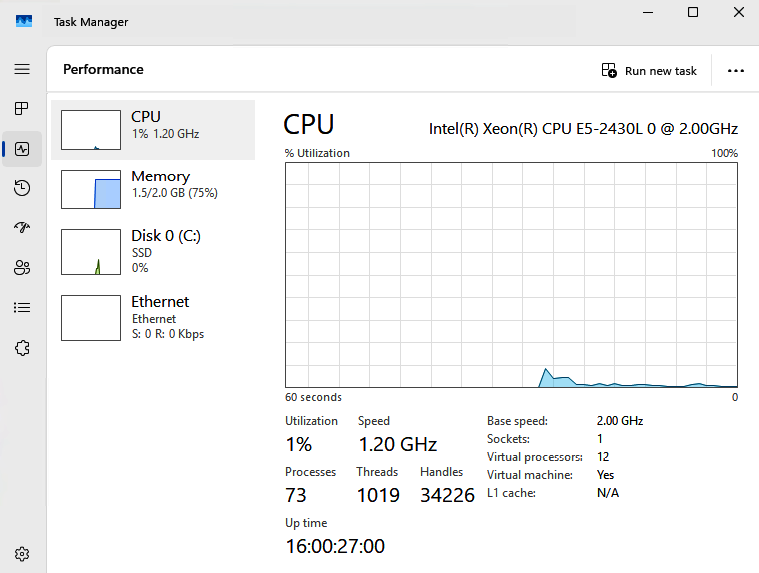
The section of Task Manager that I skipped over so that I could mention it more specifically next is the Performance tab. This is a pretty powerful one. Inside, you can quickly monitor CPU, memory, and Ethernet utilization. As you can see in the following screenshot, I haven’t done a very good job of planning resources on this particular virtual machine, as my CPU is hardly being touched but I am almost out of system memory:

Figure 1.20: Task Manager: Performance
Another useful piece of information available inside this screen is server uptime, and I visit Task Manager often for exactly this reason. Discovering the amount of time that a server has been running without a restart can be critical when troubleshooting an issue, and I watch admins time and time again calculating system uptime based on log timestamps. Using Task Manager is a much easier way to find that information!
If you are interested in viewing more in-depth data about server performance, there is another application in Windows called Resource Monitor. In fact, two other technologies provided inside Windows Server 2025 are useful for monitoring system status, particularly for hardware performance: Resource Monitor and Performance Monitor. Open up these tools and start testing them out, as they can provide both troubleshooting information and essential baseline data when you spin up a new server. This baseline can then be compared against future testing data so that you can monitor how new applications or services installed on a particular server have affected their resource consumption. We will discuss these additional monitoring tools in Chapter 17, Troubleshooting.
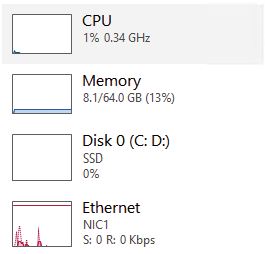
Moving back to Task Manager, there is just one other little neat trick I would like to test. Still inside the Performance tab, go ahead and right-click on any particular piece of data that you are interested in. I will right-click on the CPU information near the left side of the window. This opens up a dialog box with a few options, of which I am going to click on Summary view. This condenses the data that was previously taking up about half of my screen real estate into a tiny little window, which I can move to the corner of my screen. This is a nice way to always keep hardware utilization data on the screen as you navigate through and work on your server, so that you can watch for any spikes or increases in resource consumption when making changes to the system:

Figure 1.21: Task Manager: Summary Resources
Now let’s check out an often-underutilized function called Task View!
Change the font size
Change margin width
Change background colour