Book Image

ActionScript Graphing Cookbook

Book Image

ActionScript Graphing Cookbook

Overview of this book

"A picture is worth a thousand words" has never been more true than when representing large sets of data. Bar charts, heat maps, cartograms, and many more have become important tools in applications and presentations to quickly give insight into complicated issues.The "ActionScript Graphing Cookbook" shows you how to add your own charts to any ActionScript program. The recipes give step-by-step instructions on how to process the input data, how to create various types of charts and how to make them interactive for even more user engagement.Starting with basic ActionScript knowledge, you will learn how to develop many different types of charts.First learn how to import your data, from Excel, web services and more. Next process the data and make it ready for graphical display. Pick one of the many graph options available as the book guides you through ActionScript's drawing functions. And when you're ready for it, branch out into 3D display.The recipes in the "ActionScript Graphing Cookbook" will gradually introduce you into the world of visualization.
Table of Contents (17 chapters)
ActionScript Graphing Cookbook
Credits
About the Authors
About the Reviewers
www.PacktPub.com
Preface
Index

Building vertical bar charts


Now that we have built a bar chart using Flex, we are ready to do the same in pure ActionScript. This bar chart version will allow you to expand it in multiple ways and will remove the weight that the Flex framework adds to the file size. Now a bit about bar charts; Bar charts are good when you don't have too much data (more than 20 bars starts to make a big chart), or when you've averaged it. It is a quick way to compare data visually.

Getting ready

All we will need for this is to start a new project in FlashDevelop. Also, it would help to read about preparing data and about axes in the Adding labels and axes recipe in Chapter 1, Getting Started with Graph Drawing.

How to do it...

This section will refer a lot to the code provided with the book; check the Bar Chart folder within code files for Chapter 3. You will notice that we divided all the elements in the charts into their own classes.

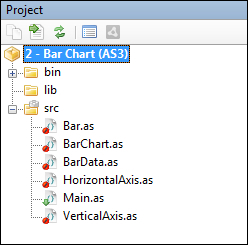
  1. It all starts in the Main.as file, where we create the data that we will...