

Adding HTML and other components to the app
From now until the end of this chapter, we will mainly be focusing on the app.layout attribute of our app and making changes to it. It's straightforward to do so; we simply add elements to the top-level html.Div element's list (the children parameter):
html.Div(children=[component_1, component_2, component_3, …])
Adding HTML components to a Dash app
Since the available components in the package correspond to actual HTML tags, it is the most stable package. Let's quickly explore the parameters that are common to all its components.
At the time of this writing, Dash HTML Components has 131 components, and there are 20 parameters that are common to all of them.
Let's go over some of the most important ones that we will frequently be using:
children: This is typically the main (and first) container of the content of the component. It can take a list of items, or a single item.className: This is the same as theclassattribute, only renamed as such.id: While we won't be covering this parameter in this chapter, it is the crucial one in making interactivity work, and we will be using it extensively while building the app. For now, it's enough to know that you can set arbitrary IDs to your components so you can identify them and later use them for managing interactivity.style: This is similar to the HTML attribute of the same name, but with a few differences. First, its attributes are set using camelCase. So, say you wanted to set the following attributes in Dash HTML Components:<h1 style="color:blue; font-size: 40px; margin-left: 20%">A Blue Heading</h1>
You would specify them this way:
import dash_html_components as html
html.H1(children='A Blue Heading',
        style={'color': 'blue',
               'fontSize': '40px',
               'marginLeft': '20%'})
As you have most likely noticed, the
styleattribute is set using a Python dictionary.
The other parameters have different uses and rules, depending on the respective component that they belong to. Let's now practice adding a few HTML elements to our app. Going back to the same app.py file, let's experiment with adding a few more HTML elements and run the app one more time, as we just did. I kept the top and bottom parts the same, and I mainly edited app.layout:
…
app = dash.Dash(__name__)
app.layout = html.Div([
    html.H1('Poverty And Equity Database',
            style={'color': 'blue',
                   'fontSize': '40px'}),
    html.H2('The World Bank'),
    html.P('Key Facts:'),
    html.Ul([
        html.Li('Number of Economies: 170'),
        html.Li('Temporal Coverage: 1974 - 2019'),
        html.Li('Update Frequency: Quarterly'),
        html.Li('Last Updated: March 18, 2020'),
        html.Li([
            'Source: ',
          html.A('https://datacatalog.worldbank.org/dataset/poverty-and-equity-database',         href='https://datacatalog.worldbank.org/dataset/poverty-and-equity-database')
        ])
    ])
])
…
python app.py
That should produce the following screen:
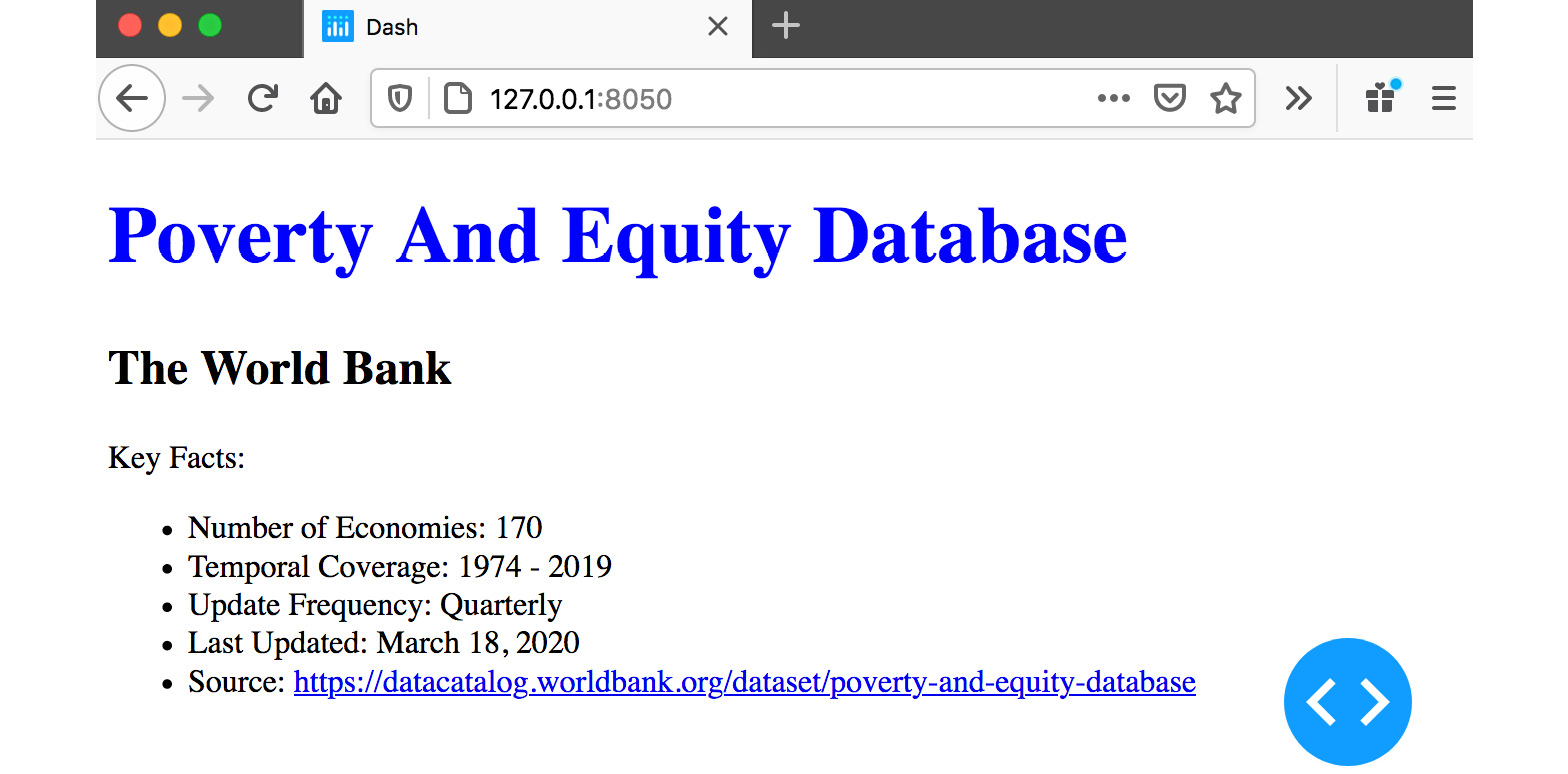
Figure 1.5 – Updated app rendered in the browser
Tip
If you are familiar with HTML, this should look straightforward. If not, please check out a basic tutorial online. A great source to start would be W3Schools: https://www.w3schools.com/html/.
In the updated part, we just added a <p> element and an unordered list, <ul>, within which we added a few list items, <li> (using a Python list), the last of which contained a link using the <a> element.
Note that since these components are implemented as Python classes, they follow Python's conventions of capitalizing class names: html.P, html.Ul, html.Li, html.A, and so on.
Feel free to experiment with other options: adding new HTML components, changing the order, trying to set other attributes, and so on.