-
Book Overview & Buying
-
Table Of Contents

Developing IoT Projects with ESP32 - Second Edition
By :
Developing IoT Projects with ESP32
By:
Overview of this book
ESP32, a low-cost and energy-efficient system-on-a-chip microcontroller, has become the backbone of numerous WiFi devices, fueling IoT innovation. This book offers a holistic approach to building an IoT system from the ground up, ensuring secure data communication from sensors to cloud platforms, empowering you to create production-grade IoT solutions using the ESP32 SoC.
Starting with IoT essentials supported by real-world use cases, this book takes you through the entire process of constructing an IoT device using ESP32. Each chapter introduces new dimensions to your IoT applications, covering sensor communication, the integration of prominent IoT libraries like LittleFS and LVGL, connectivity options via WiFi, security measures, cloud integration, and the visualization of real-time data using Grafana. Furthermore, a dedicated section explores AI/ML for embedded systems, guiding you through building and running ML applications with tinyML and ESP32-S3 to create state-of-the-art embedded products.
This book adopts a hands-on approach, ensuring you can start building IoT solutions right from the beginning. Towards the end of the book, you'll tackle a full-scale Smart Home project, applying all the techniques you've learned in real-time.
Embark on your journey to build secure, production-grade IoT systems with ESP32 today!
Table of Contents (15 chapters)
Preface

Introduction to IoT development and the ESP32 platform
 Free Chapter
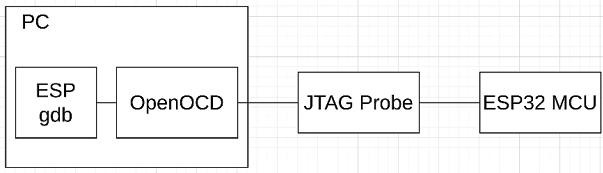
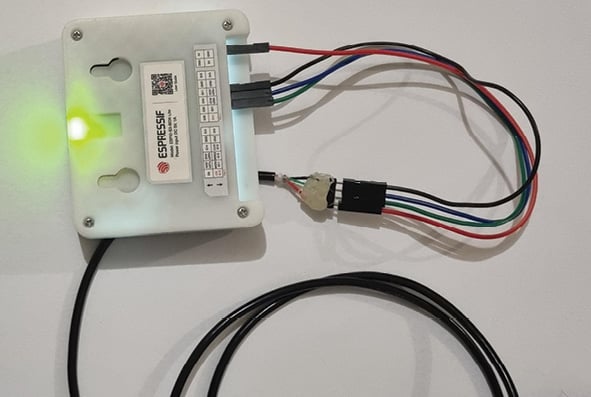
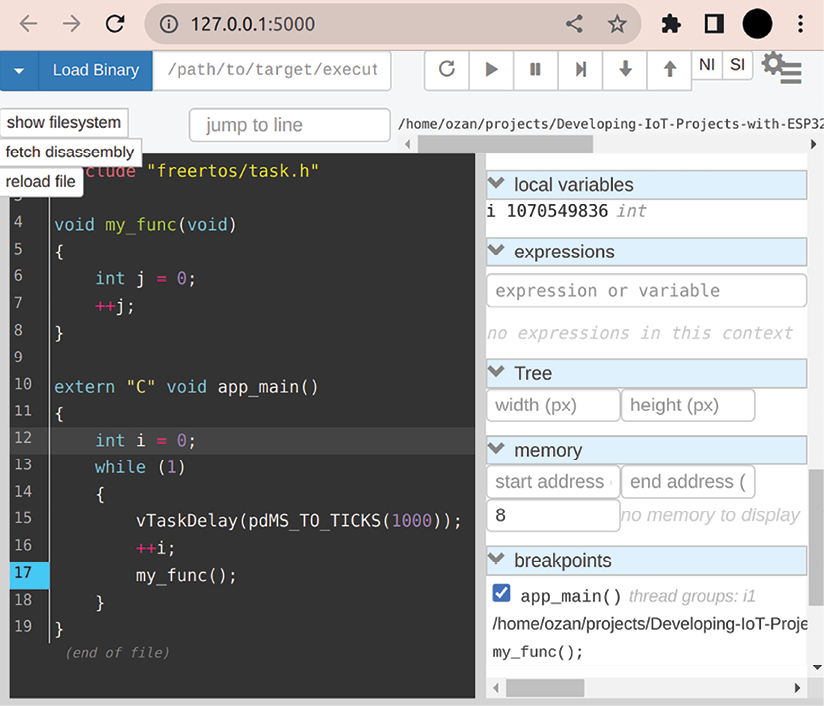
Understanding the Development Tools
Using ESP32 Peripherals
Employing Third-Party Libraries in ESP32 Projects
Project – Audio Player
Using Wi-Fi Communication for Connectivity
ESP32 Security Features for Production-Grade Devices
Connecting to Cloud Platforms and Using Services
Project – Smart Home
Machine Learning with ESP32
Developing on Edge Impulse
Project – Baby Monitor
Other Books You May Enjoy
Index