Book Image

Salesforce Lightning Reporting and Dashboards

By : Johan Yu
Book Image

Salesforce Lightning Reporting and Dashboards

By: Johan Yu

Overview of this book

Built on the Salesforce App Cloud, the new Lightning Experience combines the new Lightning Design System, Lightning App Builder, and Lightning Components to enable anyone to quickly and easily create modern enterprise apps. The book will start with a gentle introduction to the basics of Salesforce reports and dashboards. It will also explain how to access reports in depth. Then you will learn how to create and manage reports, to use Schedule Report, and create advanced report configurations. The next section talks about dashboards and will enable you to understand and compare various types of dashboard component and how you can benefit the most from each of them. Then we move on to advanced topics and explain tips and tricks related to reports and dashboards, including reporting snapshots, report parameters, and collaboration. Finally, we will discuss how to access dashboards and reports from the Salesforce1 mobile app.
Table of Contents (13 chapters)

Navigating to a dashboard

Interactive dashboard components give viewers more information and links to data-supplying reports. Let's look at all the items in a dashboard:

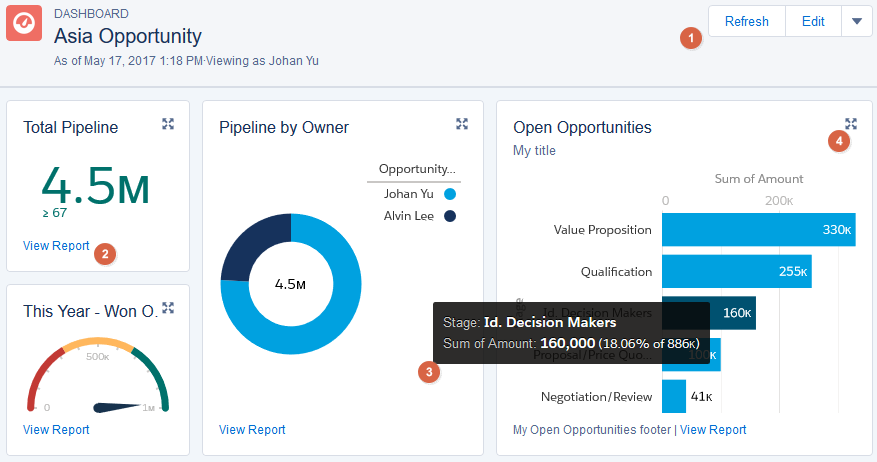
  1. Refresh, Edit, Clone, New Dashboard, or Delete: The buttons and drop-down menu at the top of each dashboard provide one-click access to administrative tasks.
  2. View Report underlying a component: Would you like to get the data behind a metric or a chart? Click on View Report to drill into the data.
  3. Hover over charts to get more information: Hovering over a chart segment reveals more information about the chart.
  4. Expand dashboard components to get the big picture: Click on the expand icon to see a larger version of the component and continue with the View Report button to drill into the data.

Dragging and dropping...