-
Book Overview & Buying
-
Table Of Contents

Microsoft Power Apps Cookbook
By :
Microsoft Power Apps Cookbook
By:
Overview of this book
Microsoft Power Apps Cookbook is a complete resource filled with meticulously crafted recipes to help you build customized business apps that meet ever-changing enterprise demands. You will learn how to design modern apps with the low-code approach in a rapid application development environment by achieving enterprise-wide business agility.
Table of Contents (13 chapters)
Preface

Chapter 1: Building pixel-perfect solutions with Canvas Power Apps
 Free Chapter
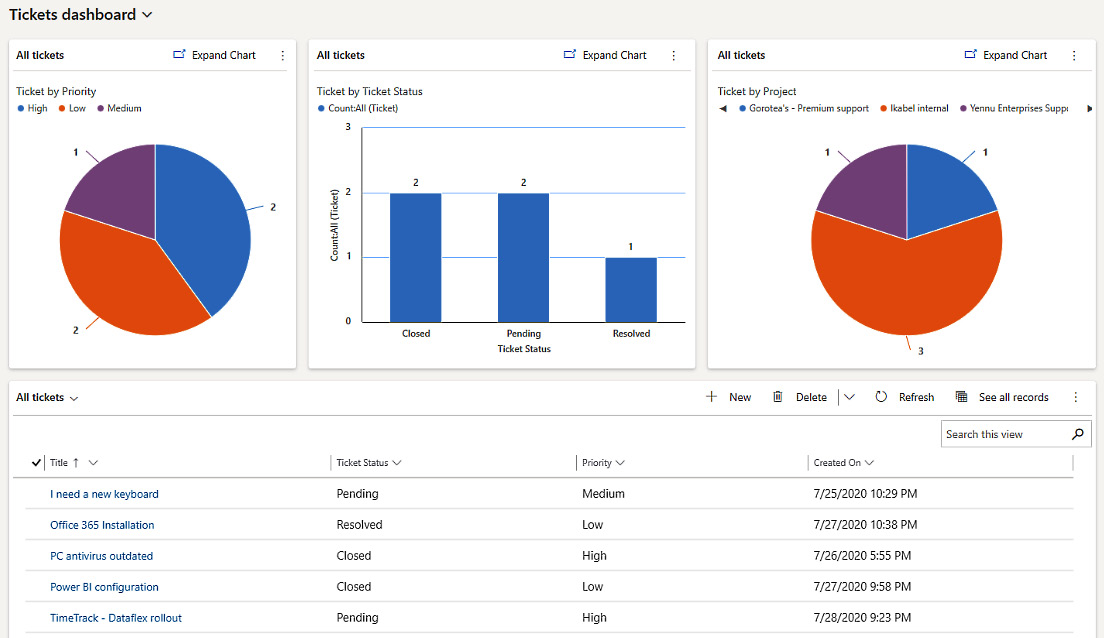
Chapter 2: Building from data with model-driven apps
Chapter 3: Choosing the right data source for your applications
Chapter 4: Automating processes with Power Automate
Chapter 5: Extending the Platform
Chapter 6: Improving User Experience
Chapter 7: Power Apps Everywhere
Chapter 8: Empowering your applications with no code Artificial Intelligence
Chapter 9: Discovering the Power Platform admin center
Chapter 10: Tips, Tricks, and Troubleshooting
Chapter 11: Advanced Techniques with Power Apps Component Framework
Other Books You May Enjoy