Book Image

SharePoint Development with the SharePoint Framework

By : Jussi Roine, Olli Jääskeläinen
Book Image

SharePoint Development with the SharePoint Framework

By: Jussi Roine, Olli Jääskeläinen

Overview of this book

SharePoint is one of Microsoft's best known web platforms. A loyal audience of developers, IT Pros and power users use it to build line of business solutions. The SharePoint Framework (SPFx) is a great new option for developing SharePoint solutions. Many developers are creating full-trust based solutions or add-in solutions, while also figuring out where and how SPFx fits in the big picture. This book shows you how design, build, deploy and manage SPFx based solutions for SharePoint Online and SharePoint 2016. The book starts by getting you familiar with the basic capabilities of SPFx. After that, we will walk through the tool-chain on how to best create production-ready solutions that can be easily deployed manually or fully automated throughout your target Office 365 tenants. We describe how to configure and use Visual Studio Code, the de facto development environment for SPFx-based solutions. Next, we provide guidance and a solid approach to packaging and deploying your code. We also present a straightforward approach to troubleshooting and debugging your code an environment where business applications run on the client side instead of the server side.
Table of Contents (14 chapters)

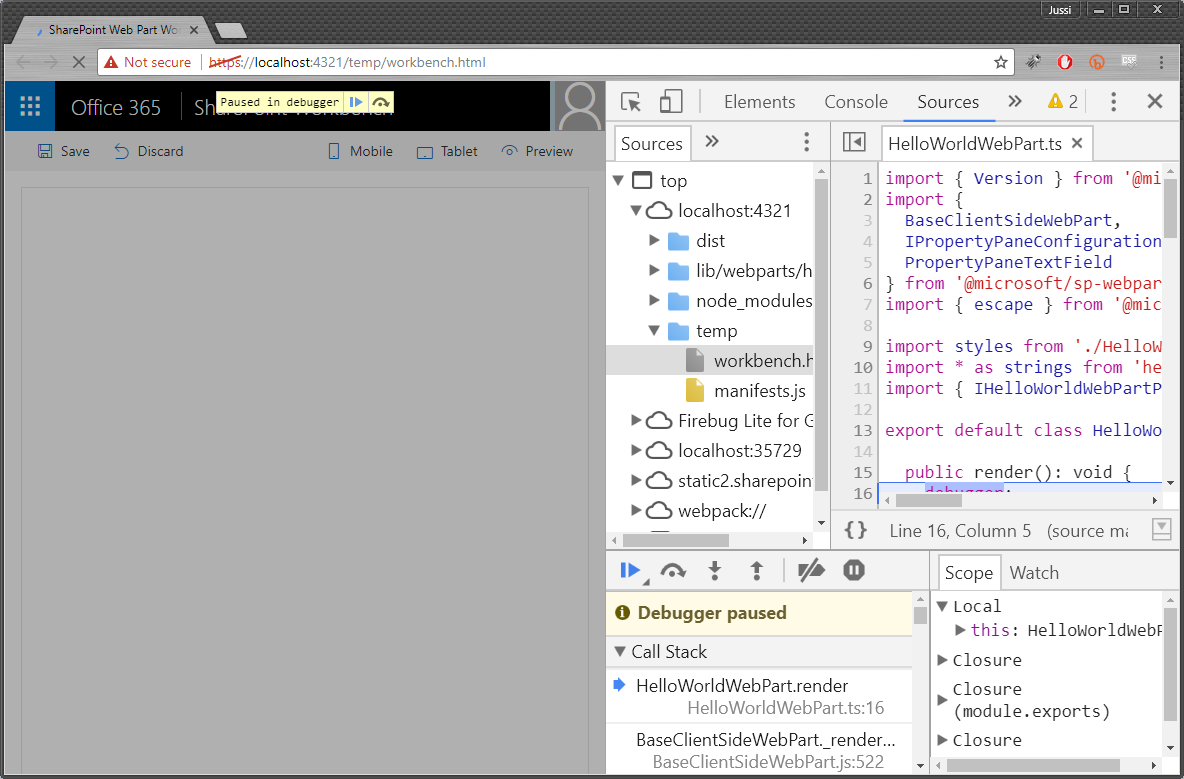
Debugger statements using browser developer tools

Debugger statements are an ingenious way to add simple breakpoint-style elements to your code that can be tripped with developer tools in your browser.

  1. To start with the debugger statements, add the debugger; statement anywhere within your TypeScript code, for example, as soon as you enter the render() function:
public render(): void {
debugger;
$(function(){
alert('hi');
});
  1. Run gulp serve to bundle the solution and wait for SharePoint Workbench to load.
  2. Add the web part on the canvas like you normally would.
  3. Press Ctrl + Shift + I in Chrome to run Developer Tools.
  4. Reload the page to trip over the debugger; statement in your code.