

After the repository is validated, we upload the repository file to the BI server and start testing to see whether everything works fine or not. We're going to upload the repository by using Enterprise Manager. But before that we'll have to increase the logging level of the user account in order to check the logs that are generated by the end users.
We'll open the Identity Manager tool that was formerly known as Security Manager. The users should be downloaded from the WebLogic Server. But downloading user-identity information can only be done in the online mode. So first we'll upload the repository.
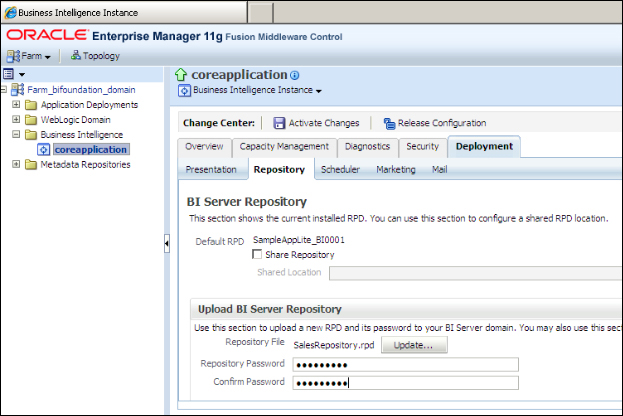
Open the Enterprise Manager 11g Fusion Middleware Control tool from
http://localhost:7001/emto upload the new repository.
When you log in, you'll see the Deployment tab and the Repository link. This is the page that we're going to upload the repository to. You'll have to show the path of the existing repository and specify the password in Repository Password.
Restart the service in order to use the new repository. Now we can run tests, but it's better to increase the logging level and also see the queries that are executed on the physical data sources. When you open BI Administration Tool in online mode, you'll be able to download the user information from the WebLogic Server and change the logging level.
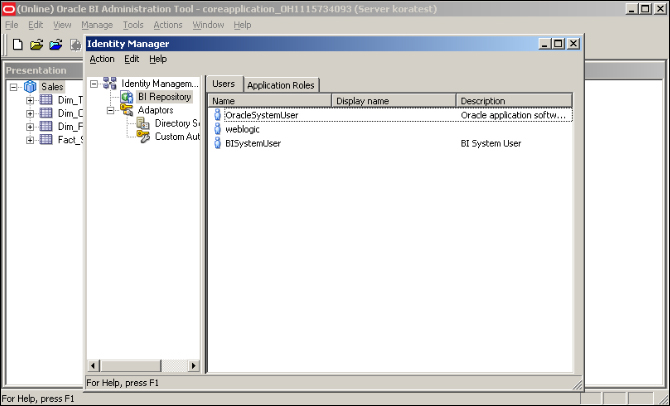
Open the properties of the user account that you'll run tests on. In our scenario, we're going to use
weblogicuser account and change the value in Logging level to2. This level is going to force the BI server to generate both the logical as well as the physical SQL statements.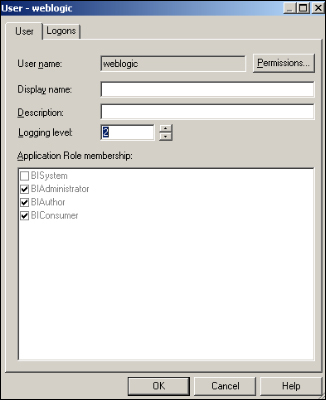
Now we can run our tests easily. We're going to use the web browser to access Presentation Service at
http://localhost:7001/analytics.
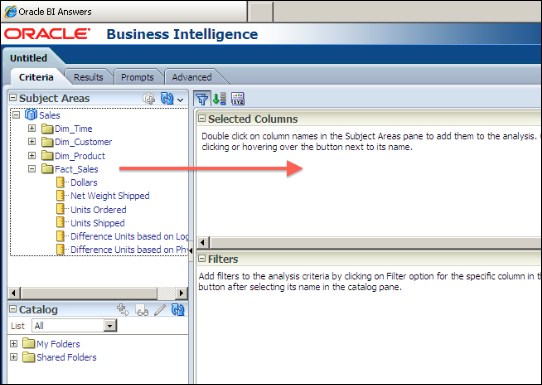
After you log in and try to create an analysis, you'll see the subject area from the Presentation layer of the repository. Click on the Subject Area name.

It's going to open the Analysis Editor. You'll see that the order of the tables and columns are exactly the same as the order of the subject areas in the Presentation layer. You can easily click on the columns from the Subject Areas pane to add them to the Selected Columns section.
Click on the Results tab on this page to see the results:

After uploading the new repository to the BI server, we'll have to make many tests in order to make sure that everything is fine. Also, logs should be checked.
To make a test, we'll have to log in to Presentation Services and create analysis. After clicking the Results tab, we should see the result set as shown in the preceding example. The logical request is going to be constructed from the definition of the analysis at the Presentation Services and it'll be retrieved by the BI server component. The BI server is going to convert the logical SQL statement to a physical SQL statement and execute it against the database. After the result set is generated by the database, that result set is going to pass through the BI server and will be listed as a result at the Presentation Services.
After changing the log level of the user that we're running the test on, we can find the execution statistics in the log file. The name of the log file is NQQuery.log. The content of the log file can be accessed from the Administration link in Presentation Services by navigating to Administration | Manage Sessions | View Log.