Book Image

Oracle Business Intelligence 11g R1 Cookbook

By : Cuneyt Yilmaz
Book Image

Oracle Business Intelligence 11g R1 Cookbook

By: Cuneyt Yilmaz

Overview of this book

<p>Extracting meaningful and valuable business information from transactional databases is crucial for any organization. OBIEE 11g is a reporting tool that satisfies all the business requirements regarding complex reporting. It consists of a powerful back-end engine with a repository and a highly customizable graphical web interface.</p> <p>Oracle Business Intelligence 11g R1 Cookbook provides all the key concepts of the product including the architecture of the BI Server. This practical guide shows each and every step of creating analytical reports starting from building a well-designed repository. You will learn how to create analytical reports that will support different business perspectives. <br /><br />This practical guide covers how to implement OBIEE 11g suite in order to enable BI developers to create sophisticated web based reports. All of tasks will be covered step by step in detail. <br /><br />You will explore the architecture of the Oracle Business Intelligence Server and learn how to build the repository (RPD). We will also discuss how to implement the business rules in the repository with real-life scenarios.</p> <p>Best practices of a successful BI implementation are esssential for any BI developer so they are also covered in depth.If you are planning to implement OBIEE 11g suite, this step-by-step guide is a must have resource.All the key tasks are defined in detail and supported with diagrams and screenshots.</p>
Table of Contents (19 chapters)
Oracle Business Intelligence 11g R1 Cookbook
Credits
About the Author
About the Reviewers
www.PacktPub.com
Preface
Index

Adding column prompts


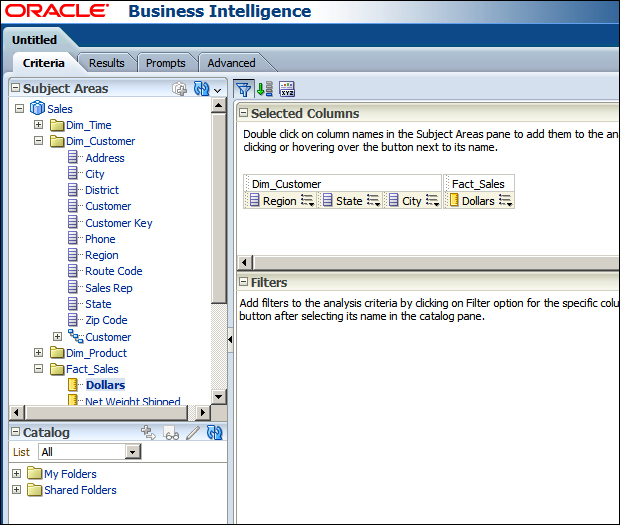
When it comes filtering data dynamically, it'll be good to allow end users to select the values from a drop-down list. We can achieve this by using Column Prompts. To demonstrate the column prompts, we're going to use a new analysis that consists of four columns as you'll see in the following screenshot:

How to do it...

  1. After creating the sample analysis, click on the Prompts tab. Click on the Add Prompt icon and go to Column Prompt | "Dim_Customer"."Region".

  2. The New Prompt: Region window will pop up on the screen. Set the Label value as Choose a Region and don't change any settings in the windows. Just click on the OK button.

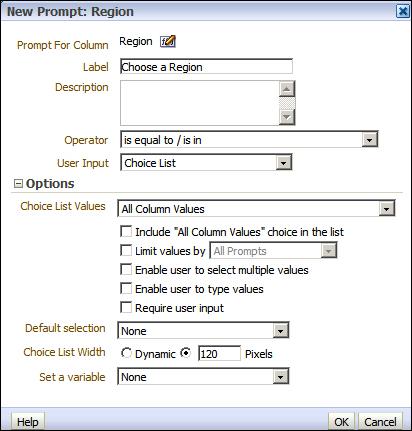
  3. You'll see that the new column prompt is created. Create one more column prompt that's based on the State column this time. But in this one, we're going to select the Limit Values by checkbox and select the Choose a Region column prompt. This setting will make the State values be populated based on the Region column values. Click on the OK button...