

Creating process diagrams automatically from data in Visio for Desktop
We have now learned about the Visio Data Visualizer add-in for Excel, but it is only one small part of the Data Visualizer tool. It can also be used to create separate Visio and Excel documents that can be synchronized with each other.
In fact, if we have Visio Plan 2 installed, we can start Data Visualizer from either Visio, shown on the left, or Excel, shown on the right in the following screenshots:
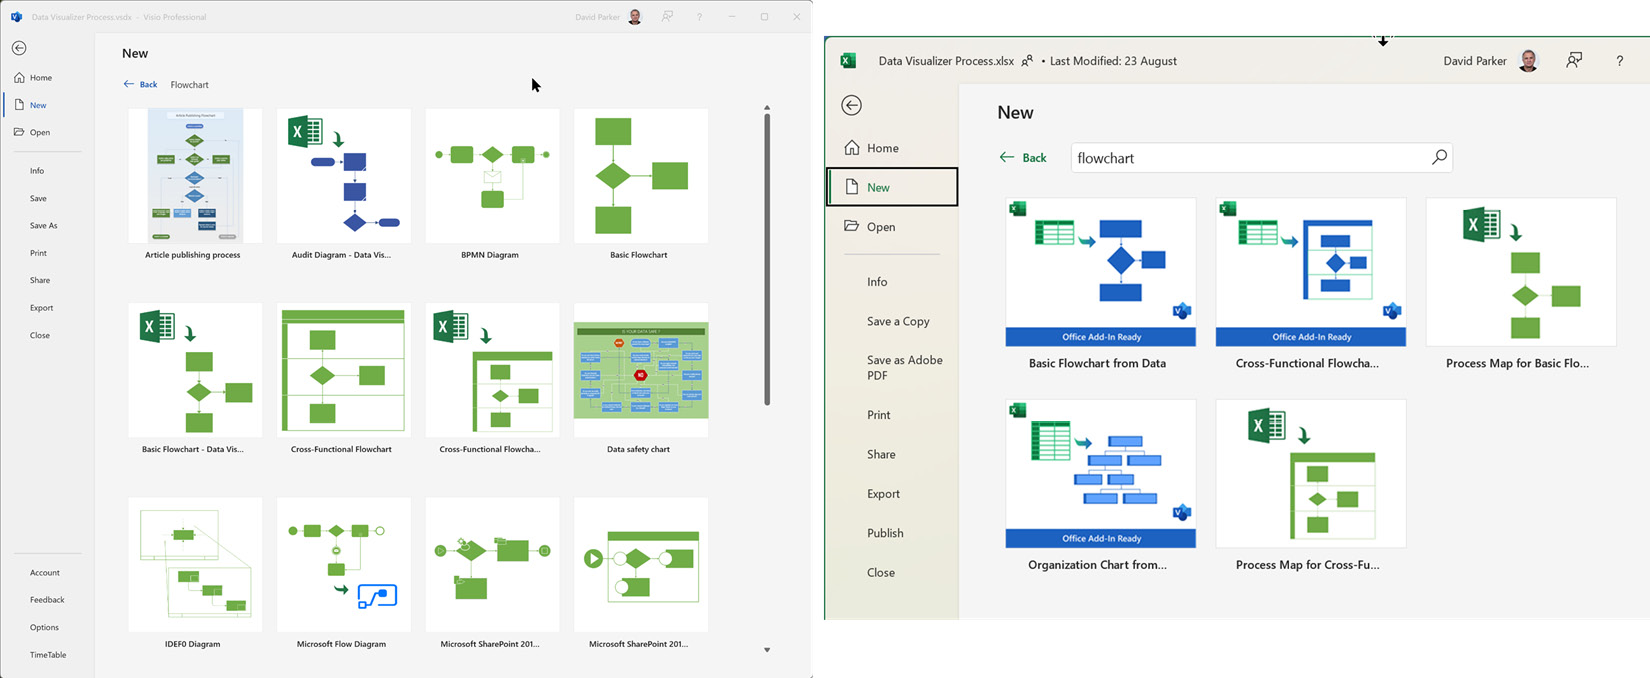
Figure 5.11 – The Data Visualizer templates with the Excel icon in the top left
If we click one of the Visio templates, such as Cross-Functional Flowchart – Data Visualizer, then we will be offered a button to start a new Excel workbook from one of the templates that would be opened from Excel.
Understanding and editing the Data Visualizer Excel workbook
The Excel template workbook displays four tabs, but there is also a hidden one that is used for a lookup:
...