

Exporting data to Microsoft Excel for integration
Our process flowcharts are a precious source of knowledge about our business, and we have learned how we can create diagrams automatically using the Data Visualizer feature, as described in Chapter 5, and how we can update a linked Excel table from the Visio flowchart. However, we may not have created our flowchart from an Excel table, or we may have used a query in Excel as a source, in which case, we are unable to update with Data Visualizer. We may want to check or analyze the data in our flowchart diagrams or integrate the data with another app or system, such as Power BI, as discussed in the next section.
Creating a report definition
We have previously looked at some parts of the Review ribbon tab in previous chapters, but now we will concentrate on the Shape Reports button. This button will open the Reports dialog, as shown here:
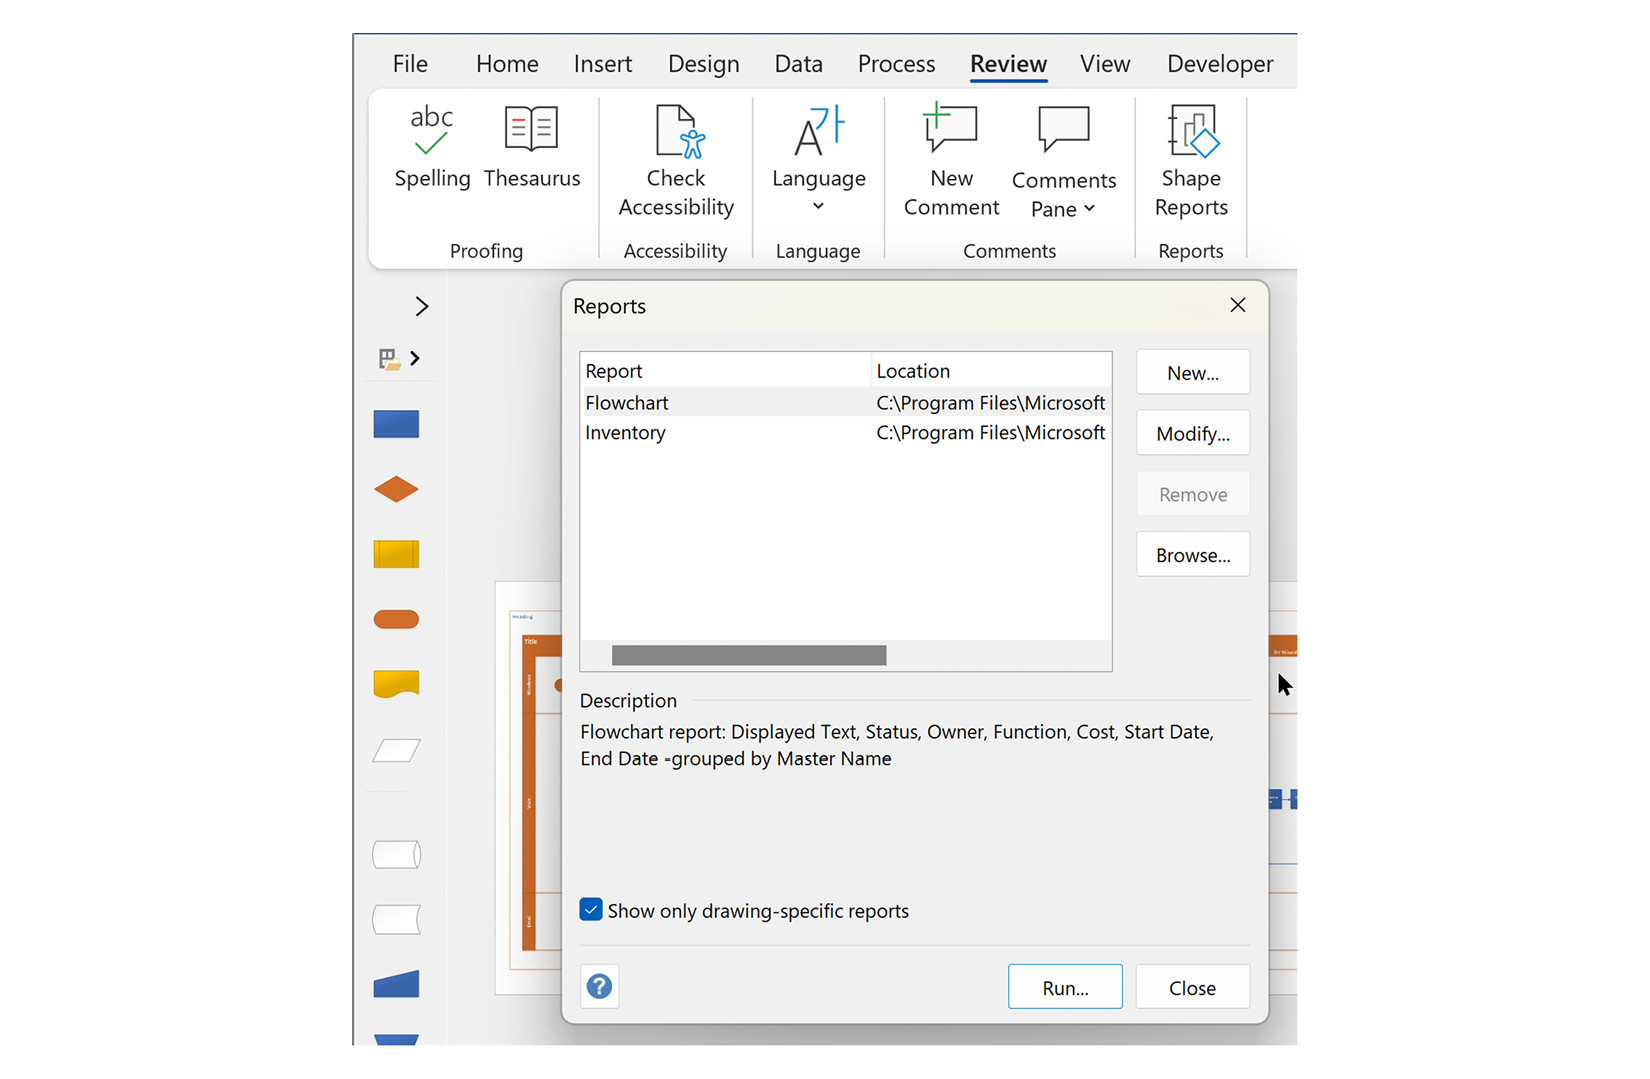
Figure 9.10 - The Review | Shape Reports dialog
This dialog will...