Book Image

Reinforcement Learning Algorithms with Python

By : Andrea Lonza
Book Image

Reinforcement Learning Algorithms with Python

By: Andrea Lonza

Overview of this book

Reinforcement Learning (RL) is a popular and promising branch of AI that involves making smarter models and agents that can automatically determine ideal behavior based on changing requirements. This book will help you master RL algorithms and understand their implementation as you build self-learning agents. Starting with an introduction to the tools, libraries, and setup needed to work in the RL environment, this book covers the building blocks of RL and delves into value-based methods, such as the application of Q-learning and SARSA algorithms. You'll learn how to use a combination of Q-learning and neural networks to solve complex problems. Furthermore, you'll study the policy gradient methods, TRPO, and PPO, to improve performance and stability, before moving on to the DDPG and TD3 deterministic algorithms. This book also covers how imitation learning techniques work and how Dagger can teach an agent to drive. You'll discover evolutionary strategies and black-box optimization techniques, and see how they can improve RL algorithms. Finally, you'll get to grips with exploration approaches, such as UCB and UCB1, and develop a meta-algorithm called ESBAS. By the end of the book, you'll have worked with key RL algorithms to overcome challenges in real-world applications, and be part of the RL research community.
Table of Contents (19 chapters)
Free Chapter
1
Section 1: Algorithms and Environments
5
Section 2: Model-Free RL Algorithms
11
Section 3: Beyond Model-Free Algorithms and Improvements
17
Assessments

Introducing TensorBoard

Keeping track of how variables change during the training of a model can be a tedious job. For instance, in the linear regression example, we kept track of the MSE loss and of the parameters of the model by printing them every 40 epochs. As the complexity of the algorithms increases, there is an increase in the number of variables and metrics to be monitored. Fortunately, this is where TensorBoard comes to the rescue.

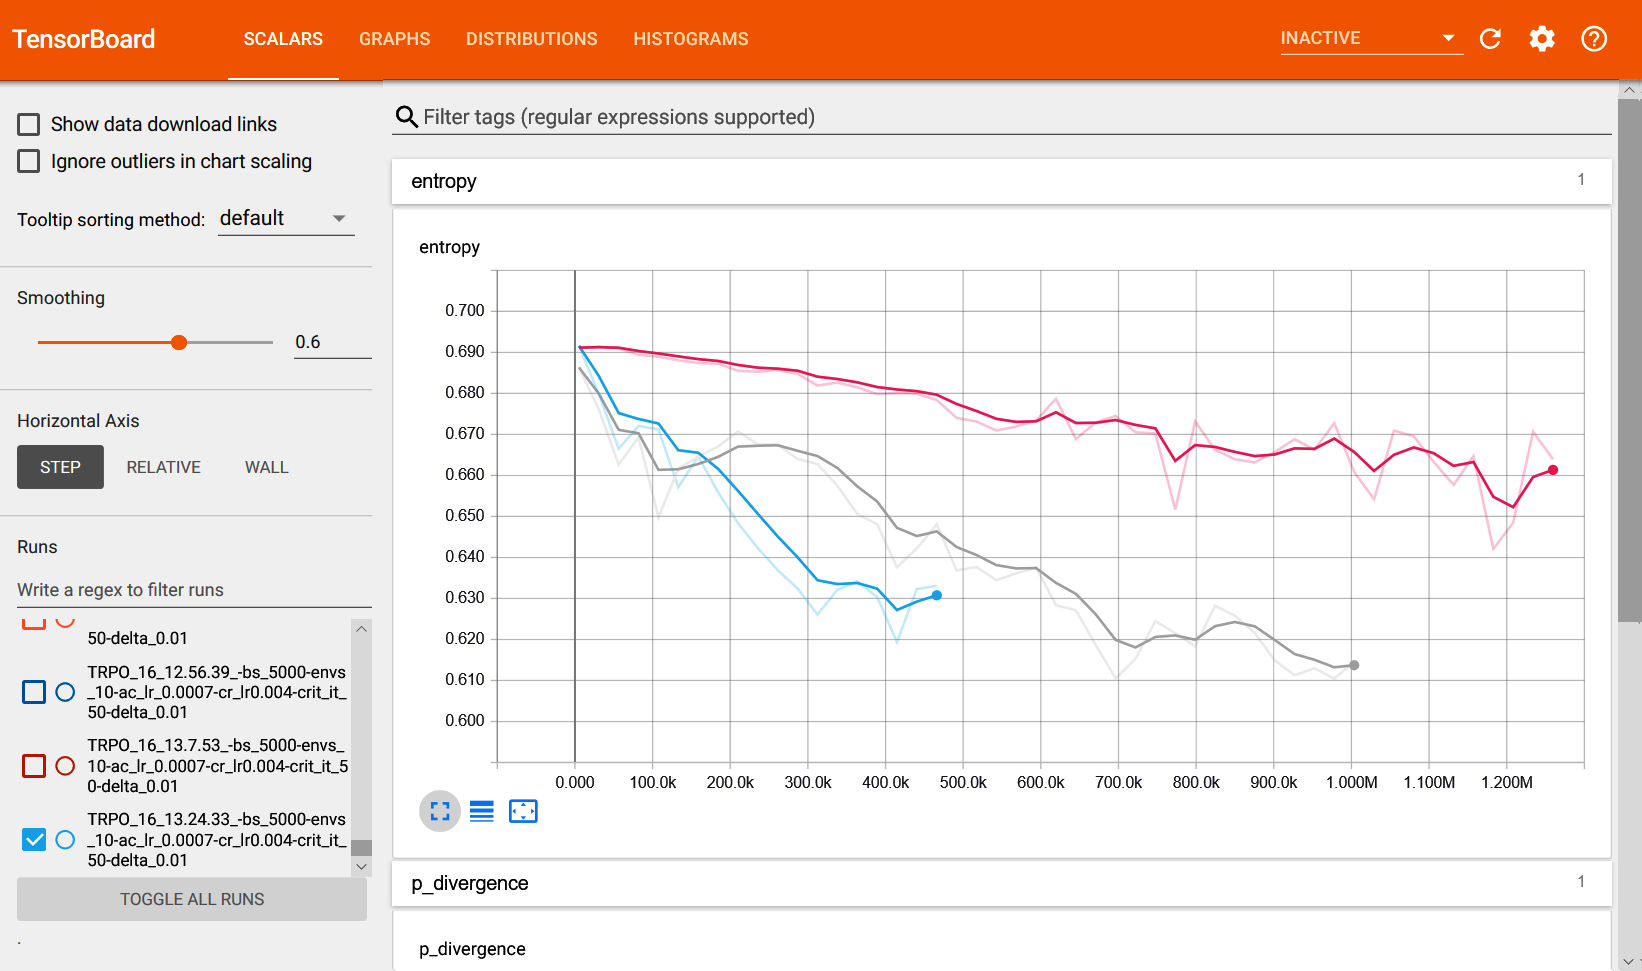
TensorBoard is a suite of visualization tools that can be used to plot metrics, visualize TensorFlow graphs, and visualize additional information. A typical TensorBoard screen is similar to the one shown in the following screenshot:

Figure 2.6: Scalar TensorBoard page

The integration of TensorBoard with TensorFlow code is pretty straightforward as it involves only a few tweaks to the code. In particular, to visualize the MSE loss over time...