

After the Chrome installation, let's open Chrome DevTools:
To do so, go in the upper-right window of Chrome and click on the icon with the three horizontal bar like the following screenshot:

Then, go to the More tools menu and click on the Developer Tools submenu, as shown in the following screenshot:

After clicking on the panel activation, the browser windows has been split to display a panel.
An alternative way to open this panel is to right-click in a web page and to click on Inspect.
You can also find the keyboards shortcut for this at https://developers.google.com/chrome-developer-tools/docs/shortcuts.
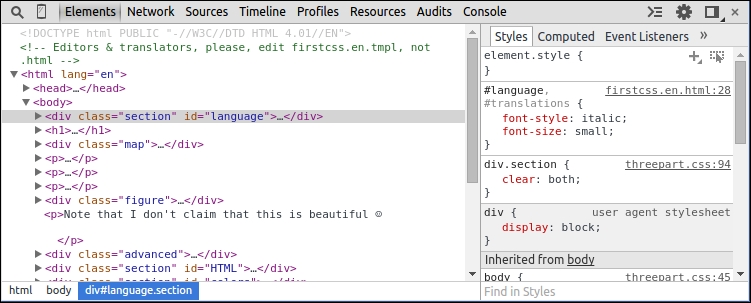
Now, let's take a look at what the tool looks like after its activation:
Note
The top row starts with a Page Inspector icon and Toogle device mode icon, which is useful for mobiles. Then, multiple panels with textual descriptions such as Elements or Network provide specific functionality (they look and act similar to tabs, but the technical term is panels). The upper row end on the right has a Show Console icon, a Settings icon, a Detached/attached debugger icon and a close button. The position of the icons may change over time as Google Developer Tools is updated; but general functionalities should remain (more or less) the same.
The following content will cover the top row icons from left to right, excluding panels.