

What we are customizing are the controls introduced in Chapter 9, Taking Control of Controls. It's time to try it: practicing things on your own will improve your comprehension. For this, we will reuse the OpenStreetMap example from Chapter 1, Getting Started with OpenLayers, and customize the position for zoom buttons and map copyrights.
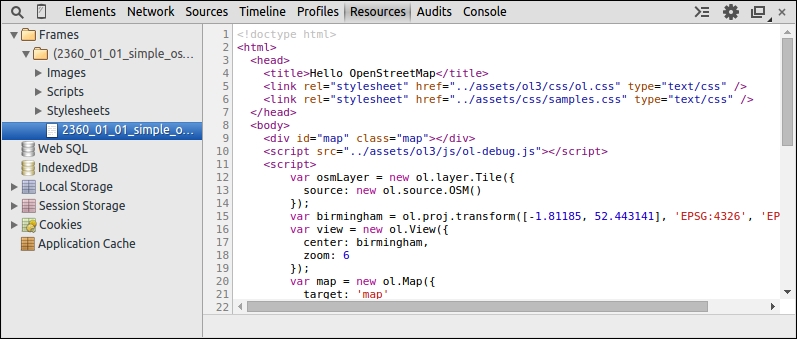
In the Sources panel, open the
ol.cssfile and use the Format button to make it more readable as this file is a.cssminified file on one line.Find the
.ol-zoomclass in theol.cssfile.Replace the
left : 0.5em;parameter withright : 0.5em;to make changes to zoom buttons.Now, it's time to change copyrights. So, like in the previous case, look for the CSS class,
.ol-attribution:not(.ol-collapsed).Change the property background,
rgba(255,255,255,0.8);, torgba(255,0,0,.4);.
In the previous example, you played with HTML content. Here, the focus was to cover how you can change the style on the fly. We set the position of the zoom control to the top right and we also changed the background for attribution when you open the attributions collapsible block (credits to maps data and tiles) to red with an opacity change. We encourage you to perform more tests on your own to assimilate the way the panel works.
If you are a web designer working on the code or a web developer requiring to make some designs, we advise you to play a lot with this powerful panel. It can greatly speed up your development time when you master it. If you are always editing CSS in your browser, you should consider looking into the Workspace functionality we've already talked about.
The Chrome DevTools Console panel is where we'll spend most of our time. It acts as a powerful JavaScript command line, or interpreter, which means we can type in JavaScript code and execute it right away—no need to save or edit any files. We can also inspect values when we are stopped at a breakpoint in the Sources panel and want to inspect the context at this time.
Another thing that makes this panel so useful is that we can interact directly with the DOM (Document Object Model)—any HTML element on the web page, including any existing JavaScript code the page contains. So, this means we're able to interact with our OpenLayers map on the fly, issuing command and testing code to instantly see what works and what doesn't. As you can imagine, this saves a ton of time!
You can choose and type in the console on one line or multi-lines. To use multi-lines, type Shift + Enter to return without executing code.
When you need to discover the structure of an object, the Console panel is a very valuable tool, especially when you want to take a peek at JavaScript components. Assuming we are looking at a page that includes OpenLayers, we can quickly see all of OpenLayer's classes, functions, and so on. It is not a replacement for the API docs, but serves as a good, quick way to view such information.
It looks like the screenshot that follows:
With it, you have a classification of all types of resources. You get all resources depending on frames such as the images, CSS, and HTML files. It is a good way to know what your web page loads.
You also can see all persistent storage. Persistent storage are Web SQL, IndexedDB, Local Storage, Session Storage, and Cookies. Although they might not mean much to you, they provide features, not directly related to OpenLayers, can be useful as they are HTML5 features. We invite you to discover their purpose by visiting http://html5demos.com.
With this various storage, you can keep information for customizing users' experiences. For example, you can use them to customize the language for a web application, store the zoom level for a displayed map, and so on.
To complete and end this panel description, the last thing we need to inspect is the Application Cache. It is the most useful function for our book in Chapter 10, OpenLayers Goes Mobile. It helps you inspect the data cached using the MANIFEST file.
These three panels are not really useful for beginners. They target advanced developers mainly for performances purposes:
The Timeline panel enables you to record how the page content is processed to display the final image you see in the browser.
The Profile panel is mainly to evaluate computer resources consumed by the web page such as the memory consumed by JavaScript, the CSS selectors efficiency, and the overall memory allocation.
The Audits panel, like the name indicates, is an audit to give you information for improving performances at the network level or CSS levels for example.
If you want more information about these panels, visit the official documentation of Chrome DevTools at https://developers.google.com/chrome-developer-tools/.
Each panel serves a certain purpose and all of Google Chrome DevTools' panels are extremely useful, but throughout this book, we will be mainly focusing on the following panels:
The Console panel (Command-line JavaScript)
The Elements panel
The Sources panel
The Network panel
These four panels are the ones that we should use the most throughout this book. We can occasionally come back to the other panels, but we don't need to spend a whole lot of time with them. However, before we conclude this chapter, let's get a bit more familiar with the Console panel, since we will need it in most of our chapters.