

In this section, we will see each button in the Chrome Developer Developer Tools to review the available functions you can perform with the debugger.
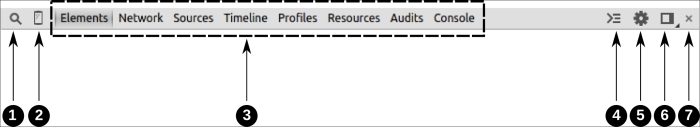
The Page Inspec tor(1) icon: This icon, a magnifying glass, is the HTML Inspector. When you click on it, the mouse cursor will identify HTML elements on the web page. So, when the mouse hovers over anything on a website, the element will be outlined in blue and the HTML panel will open up and show you the element your mouse is over.
The Toogle Device mode(2) icon: This is when you need to test different mobile screen resolutions or you want to use simulation for Geolocation. It's a component in the Google Developer Tools that have changed several times. So, we prefer to redirect you to official doc https://developer.chrome.com/devtools/docs/device-mode as it may change again.
It's the various panels (3) we will review just after all the tool bar options reviews.
The Console(4) icon: This icon is a way to display the console, a tool for exploring JavaScript. You click on it to display a new window below the bottom row. When activated, the grey icon changes to blue. We will explore it further when describing the console panel. Just before this icon, you will see errors and warnings appear if there are any in the web page you are browsing.
The Settings(5) icon: this icon displays a new panel with three vertical tabs. The first one is dedicated to the General settings. The second is Workspace. Its goal is to make the editing done in the Sources panel persistent. The last, Shortcuts, is the reminder of all shortcuts needed to be efficient when using the debugger. It contains more or less the information available in the shortcuts web page provided some pages before.
The Attached/detached debugger(6) icon: This enables you to display the debugger with fullscreen web page with a separated window or with the debugger view integrated in the current page (aligned to bottom or right). To switch between those modes, click or click and hold access the several options.
The top row set of controls is called panels; each panel provides a different type of function. The panels act like tabs (the two terms can be used interchangeably), but Chrome Developer Tools refers to them as panels in the documentation. Let's go over each panel, since they are, essentially, what makes up Chrome DevTools. We will not go over these panels from left to right, but instead we will look at the most important ones for beginners first.
The Elements panel provides not just a display of the HTML source code, but also the ability to quickly edit any HTML element and its associated style. It allows users to add, remove, and move HTML elements, edit HTML attributes, and change nearly anything about the page without having to save any files. It also can track when attributes or elements are created, changed, or removed. This helps to make web development much easier and faster.
Chrome DevTools automatically builds a tree structure from HTML code, giving the ability to expand and hide each HTML tag. It is important to note that the code you see in the HTML panel is a generated HTML code—the code in the panel may not be exactly the same as the page's source code (because the browser is interpreting the HTML to be able to show a page content).
Here is what the Elements tab looks like when Chrome DevTools is opened while viewing a web page:
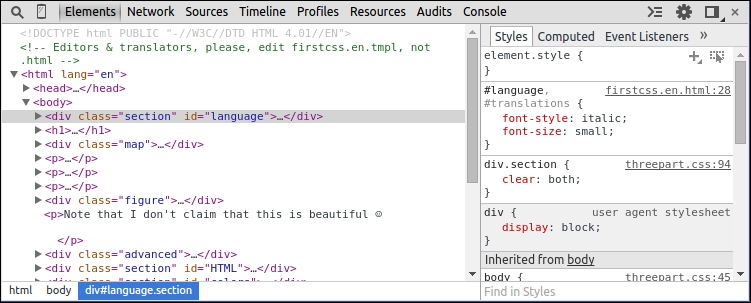
On the left-hand side, Chrome DevTools shows the HTML of the page. It's possible to right-click on any tag and do various things—such as copying the HTML to the clipboard, deleting the element, changing the tag attributes, and more.
On the right-hand side, the associated style information for the selected element is displayed. Properties can be added or modified and will instantly appear on the page, like in the preceding capture image example (at http://www.w3.org/Style/Examples/011/firstcss.en.html), with the div element with id attribute value to language
. Looking at the CSS on the right-hand side, there is a definition for the language id but only font-size and font-style properties are defined. We also see that some other styles are coming from the body element parent. The <div> tag inherits from body the color #333333 or the font-family properties.
Note
If you are unfamiliar with HTML or CSS, the WebPlatform site is a great resource. For more information on HTML, visit http://docs.webplatform.org/wiki/html, and for CSS, visit http://docs.webplatform..
What does this mean? Well, Chrome DevTools lists all inherited style information, and parent element styles propagate down to all their child elements (each child has all its parent's styles, unless the child overrides a style, which doesn't happen in this example).
By double-clicking on pretty much anything in the HTML or CSS list, you can quickly change values and names. Any change you make will immediately show up on the page, which makes it very easy to change style in real time and see how the page is affected without having to edit and save any files.
When you're playing with CSS, you can disable a property with a left click on the left part of the CSS property. You can try this on font-size to see visual change. For CSS, when the code really inherits from a lot of properties, we advise you to go to sub-panel Computed on the right part of Elements panel. You get the summary overview for each property. Play around with it a bit—if you mess anything up, you can just reload the page in Chrome.
When editing pages with Google Chrome Developer Tools, any changes you make will disappear when you refresh the page. You are not editing the actual web server's files with Google Chrome Developer Tools—instead, you are editing a copy that is on your computer that only you can see when you make changes to it. So, if you make changes and want them to be saved, you'll have to edit your actual source code.
Tip
In fact, one way to directly edit and save content within Google Chrome Developer Tools is to rely on the Workspace ability we already have evocated when clicking in the Settings icon. Check out the official Chrome Developer browser documentation at https://developer.chrome.com/devtools/docs/workspaces.
Until now, we focused on the right part of panel elements. Let's see how to manipulate and inspect DOM elements in the left Elements window.