

The second function, arc(xPos,yPos,radius,startAngle,endAngle,anticlockwise), is much easier and is used to develop our new recipe. The parameters here mean the following:
xPos: The x coordinate of the arc's center.yPos: The y coordinate of the arc's center.radius: The arc's radius.startAngle: The angle at which the arc starts, measured clockwise from the positive x axis and expressed in radians.endAngle: The angle at which the arc ends, measured clockwise from the positive x axis and expressed in radians.Anticlockwise(optional): A Boolean value which, ifTrue, causes the arc to be drawn counter-clockwise between the two angles. By default the arc is drawn clockwise.
Two new things are introduced here:
The
fillStyleproperty, which decides the color with which the arc needs to be filledThe
fill()method, which actually fills the area of the arc that you draw
The output of this recipe looks like this:
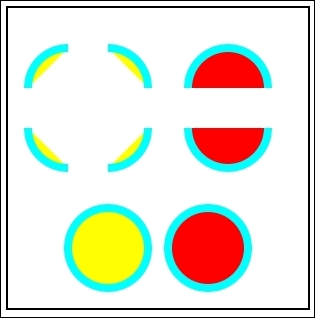
Here is the recipe:
<html>
<head>
<title>Arcs</title>
<script>
  function init()
  {
  can = document.getElementById("MyCanvasArea");
  ctx = can.getContext("2d");

    drawArc(60,80,40,180,270,false,"aqua","yellow");
    drawArc(120,80,40,270,360,false,"aqua","yellow");
    drawArc(220,80,40,180,360,false,"aqua","red");

    drawArc(60,150,40,90,180,false,"aqua","yellow");
    drawArc(120,150,40,0,90,false,"aqua","yellow");
    drawArc(220,150,40,0,180,false,"aqua","red");

    drawArc(100,250,40,0,360,false,"aqua","yellow");
    drawArc(200,250,40,360,0,false,"aqua","red");

    //function to draw curve
    function drawArc(xPos,yPos,radius,startAngle,endAngle,anticlockwise,lineColor, fillColor,width)
       {
          var startAngle = startAngle * (Math.PI/180);
          var endAngle   = endAngle   * (Math.PI/180);

          var radius = radius;

          ctx.strokeStyle = lineColor;
          ctx.fillStyle   = fillColor;
          ctx.lineWidth   = width;

          ctx.beginPath();
          ctx.arc(xPos,yPos,radius,startAngle,endAngle,anticlockwise);

          ctx.fill();
          ctx.stroke();
       }
}
</script>
</head>
<body onload="init()">
<canvas ID="MyCanvasArea" width="300" height="300" style="border:2px solid black;">
  your browser doesn't support canvas
</canvas>
</body>
</html>Consider the following diagram for an explanation:
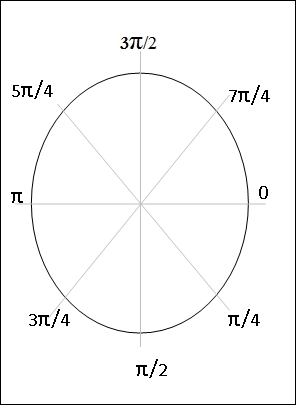
The arc function accepts the angles in radians. Refer to the circle shown previously for a better understanding. If you specify the start angle as zero and end angle as π, then you should see a semicircle drawn in a clockwise direction (starting from zero through π/2 and ending on π). If you are comfortable with angles in degrees then they need to be converted into radians before passing into the function. The formula for conversion is: Value in Radians = value in degrees * (π/180).
A partial chart of conversion is shown as follows:
|
Angle in degrees |
Angle in radians |
|---|---|
|
|
|
|
|
|
|
|
|
|
|
|
|
|
|
|
|
|
|
|
|