
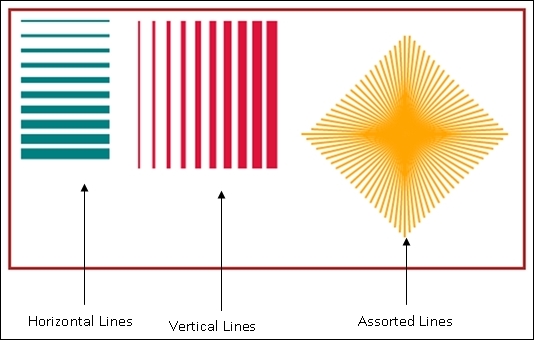
The output of our second recipe looks like this:
A small change in the previous example builds our new recipe.
You need to do the following to build this recipe:
Add three different functions named
drawHorizontalLines(),drawVerticalLines(), anddrawAssortedLines()to the<script>tag.Call these functions through the
init()method, the same way as thedrawLine()function was called.
After making the necessary changes, our recipe looks like this:
<html>
<head>
  <title>Lines Lines and More Lines</title>
    <script type="text/javascript">
      var can;
      var ctx;
      function init() {
        can = document.getElementById("MyCanvasArea");
        ctx = can.getContext("2d");
        drawHorizontalLines();
        drawVerticalLines();
        drawAssortedLines();
      }
      function drawLine(xstart,ystart,xend,yend,width,color)
      {
        ctx.beginPath();
        ctx.strokeStyle=color;
        ctx.lineWidth=width;
        ctx.moveTo(xstart,ystart);
        ctx.lineTo(xend,yend);
        ctx.stroke();
        ctx.closePath();
      }
      function drawHorizontalLines()
      {
        xs=10;  ys=10;xe=100; ye=10;
        c="teal"; w=2;
        //draw 10 lines
        for(i=1;i<=10;i++)
        {
          drawLine(xs,ys,xe,ye,w++,c);
          ys+=15;  //change through y axis
          ye+=15;
        }
      }
      function drawVerticalLines()
      {
        xs=130;  ys=10;xe=130;ye=160;
        c="crimson";w=2;
        //draw 10 lines
        for(i=1;i<=10;i++)
        {
          drawLine(xs,ys,xe,ye,w++,c);
          xs+=15; //change through x axis
          xe+=15;
        }
      }
      function drawAssortedLines()
      {
        //center point
        xcenter=400;ycenter=125;  xe=xcenter-100;ye=ycenter;
        c="orange";  w=2;
        //Second quadrant
        for(xe=xcenter-100;xe<=xcenter;xe+=5,ye-=5)
          drawLine(xcenter,ycenter,xe,ye,w,c);
        //first quadrant
        for(ye=ycenter-100;ye<=ycenter;xe+=5,ye+=5)
          drawLine(xcenter,ycenter,xe,ye,w,c);
        //fourth quadrant
        for(xe=xcenter+100;xe>=xcenter;xe-=5,ye+=5)
          drawLine(xcenter,ycenter,xe,ye,w,c);
        //third quadrant
        for(ye=ycenter+100;ye>=ycenter;xe-=5,ye-=5)
          drawLine(xcenter,ycenter,xe,ye,w,c);
      }
    </script>
</head>
<body onload="init()">
  <br/><br/>
  <center>
  <canvas id="MyCanvasArea" height="260" width="520" style="border:3px solid brown;">
  </canvas>
  </center>
</body>
</html>
For convenience, the function names and their calls shown through init() are made in bold to help you to understand where to make changes in the previous recipe.
The basic functions moveTo() and lineTo() remain the same. However, three different functions are created, which contain loops to repeatedly call the previously mentioned line drawing function.
In the drawHorizontalLines(),the lines are drawn along the x axis. In each iteration, the width of the line increases, thereby showing a gradual increase in thickness.
In the drawVerticalLines() function, the lines are drawn along the y axis.
The function drawAssortedLines() has four different loops drawing lines in four different quadrants. The drawLine() function is used in the loop and, in every iteration, the parameter values for the function change to draw lines starting from different coordinates. For instance, in the first loop, the value of xe starts from 300, which is less than the value of xcenter. So, we start drawing from the left side of the center. On every iteration, the value of xe increases and the value for ye decreases by 5. Thus, the starting point of a line moves a bit inwards and a bit upwards. The line is drawn from (xe,ye) to (xcenter,ycenter). The quadrants are filled in, in an anticlockwise direction, starting from the 2nd quadrant.
When you apply the concept of quadrants, bear in mind that the center is (400,125) and not (0,0).
All three functions mentioned previously are called within init().