

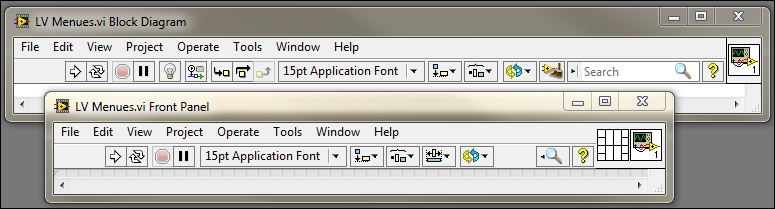
Once the LabVIEW application is launched, by default two blank windows open simultaneously-a Front Panel and a Block Diagram window-and a VI is created:
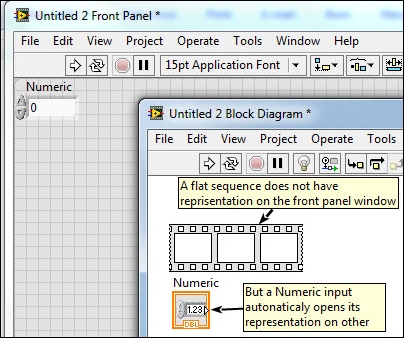
VIs are the heart and soul of LabVIEW. They are what separate LabVIEW from all other text-based development environments. In LabVIEW, everything is an object which is represented graphically. A VI may only consist of a few objects or hundreds of objects embedded in many subVIs. These graphical representations of a thing, be it a simple while loop, a complex mathematical concept such as Polynomial Interpolation, or simply a Boolean constant, are all graphically represented. To use an object, right-click inside the Block Diagram or Front Panel window, a pallet list appears. Follow the arrow and pick an object from the list of objects from subsequent pallet and place it on the appropriate window. The selected object can now be dragged and placed on different locations on the appropriate window and is ready to be wired. Depending on what kind of object is selected, a graphical representation of the object appears on both windows. Of course, there are many exceptions to this rule. For example, a while loop can only be selected in Block Diagram and, by itself, a while loop does not have a graphical representation on the Front Panel window. Needless to say, LabVIEW also has keyboard combinations that expedite selecting and placing any given toolkit objects onto the appropriate window:
Each object has one (or several) wire connections going into it as input(s) and coming out as its output(s). A VI becomes functional when a minimum number of wires are appropriately connected to the input and output of one or more objects. Later, we will use an example to illustrate how a basic LabVIEW VI is created and executed.