Book Image

Getting Started with Tableau 2018.x

By : Tristan Guillevin
Book Image

Getting Started with Tableau 2018.x

By: Tristan Guillevin

Overview of this book

Tableau is one of the leading business intelligence tools used worldwide, in organizations of every scale. In its latest release, Tableau 2018 promises richer and more useful features related to visual analytics, reporting, dashboarding, and a host of other data visualization aspects. Getting Started with Tableau 2018.x will get you up and running with these features. The book starts with all the new functionalities of the different Tableau 2018 versions, along with concrete examples of how to use them. However, if you're new to Tableau, don't worry! The rest of the book will guide you through each major aspect of Tableau with examples. You'll learn how to connect to data, build a data source, visualize your data, build a dashboard, and share it online. In the final chapters, you'll also learn advanced techniques such as creating a cross-database join, data blending, and more. By the end of the book, you will have a firm understanding of how to effectively use Tableau to create quick, cost-effective, and business-efficient business intelligence solutions.
Table of Contents (21 chapters)
Title Page
Copyright and Credits
Packt Upsell
Contributors
Preface
Free Chapter
1
Catching Up with Tableau 2018
Index

Speaking Tableau


Rather than a big list of all the terms, let's go through the basic Tableau usage.

When you open Tableau, you start working on a Workbook. After you're done working, you save your work in that Workbook (a .twb or .twbx file). You can open multiple instances of Tableau, each of them being a different Workbook.

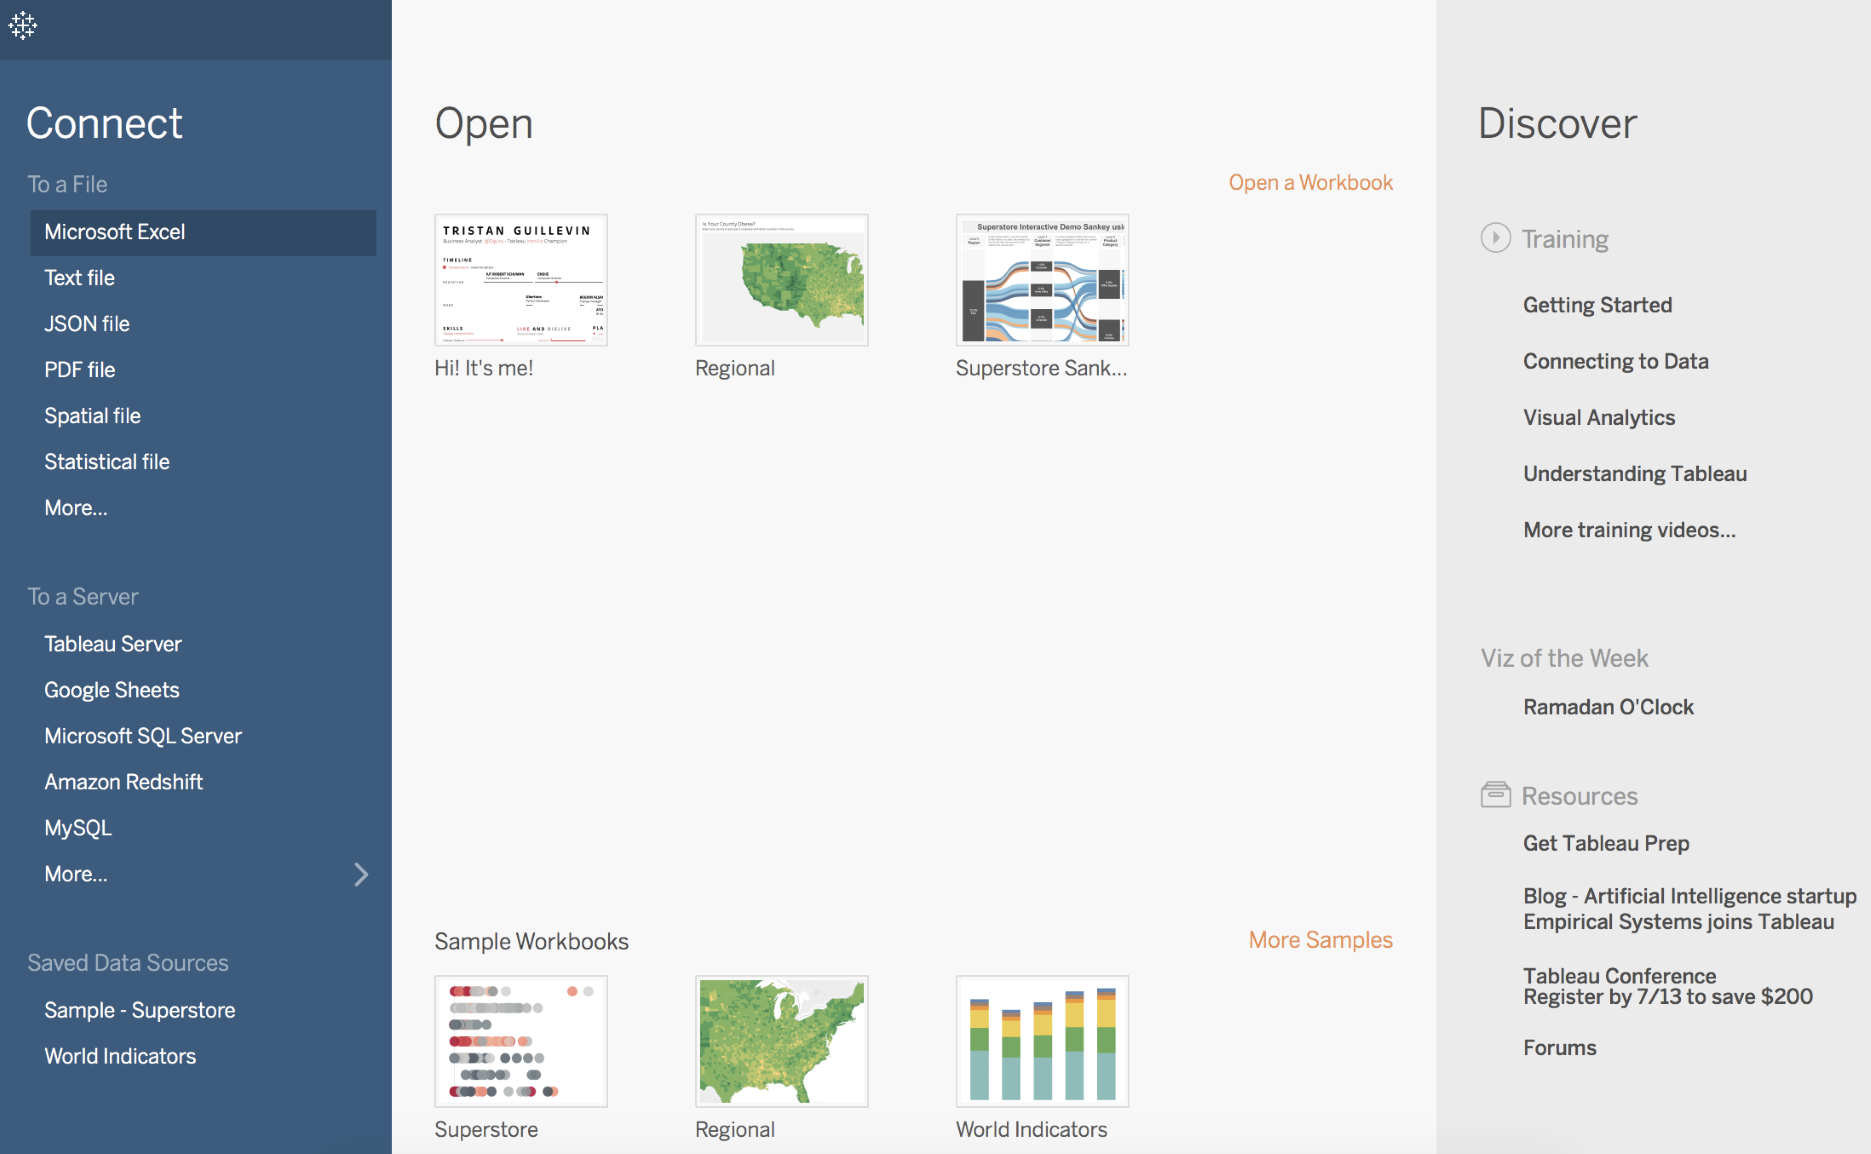
The first page when creating a Workbook is the start page. Here, you can Connect to data and open recent Workbooks. Here is the start page:

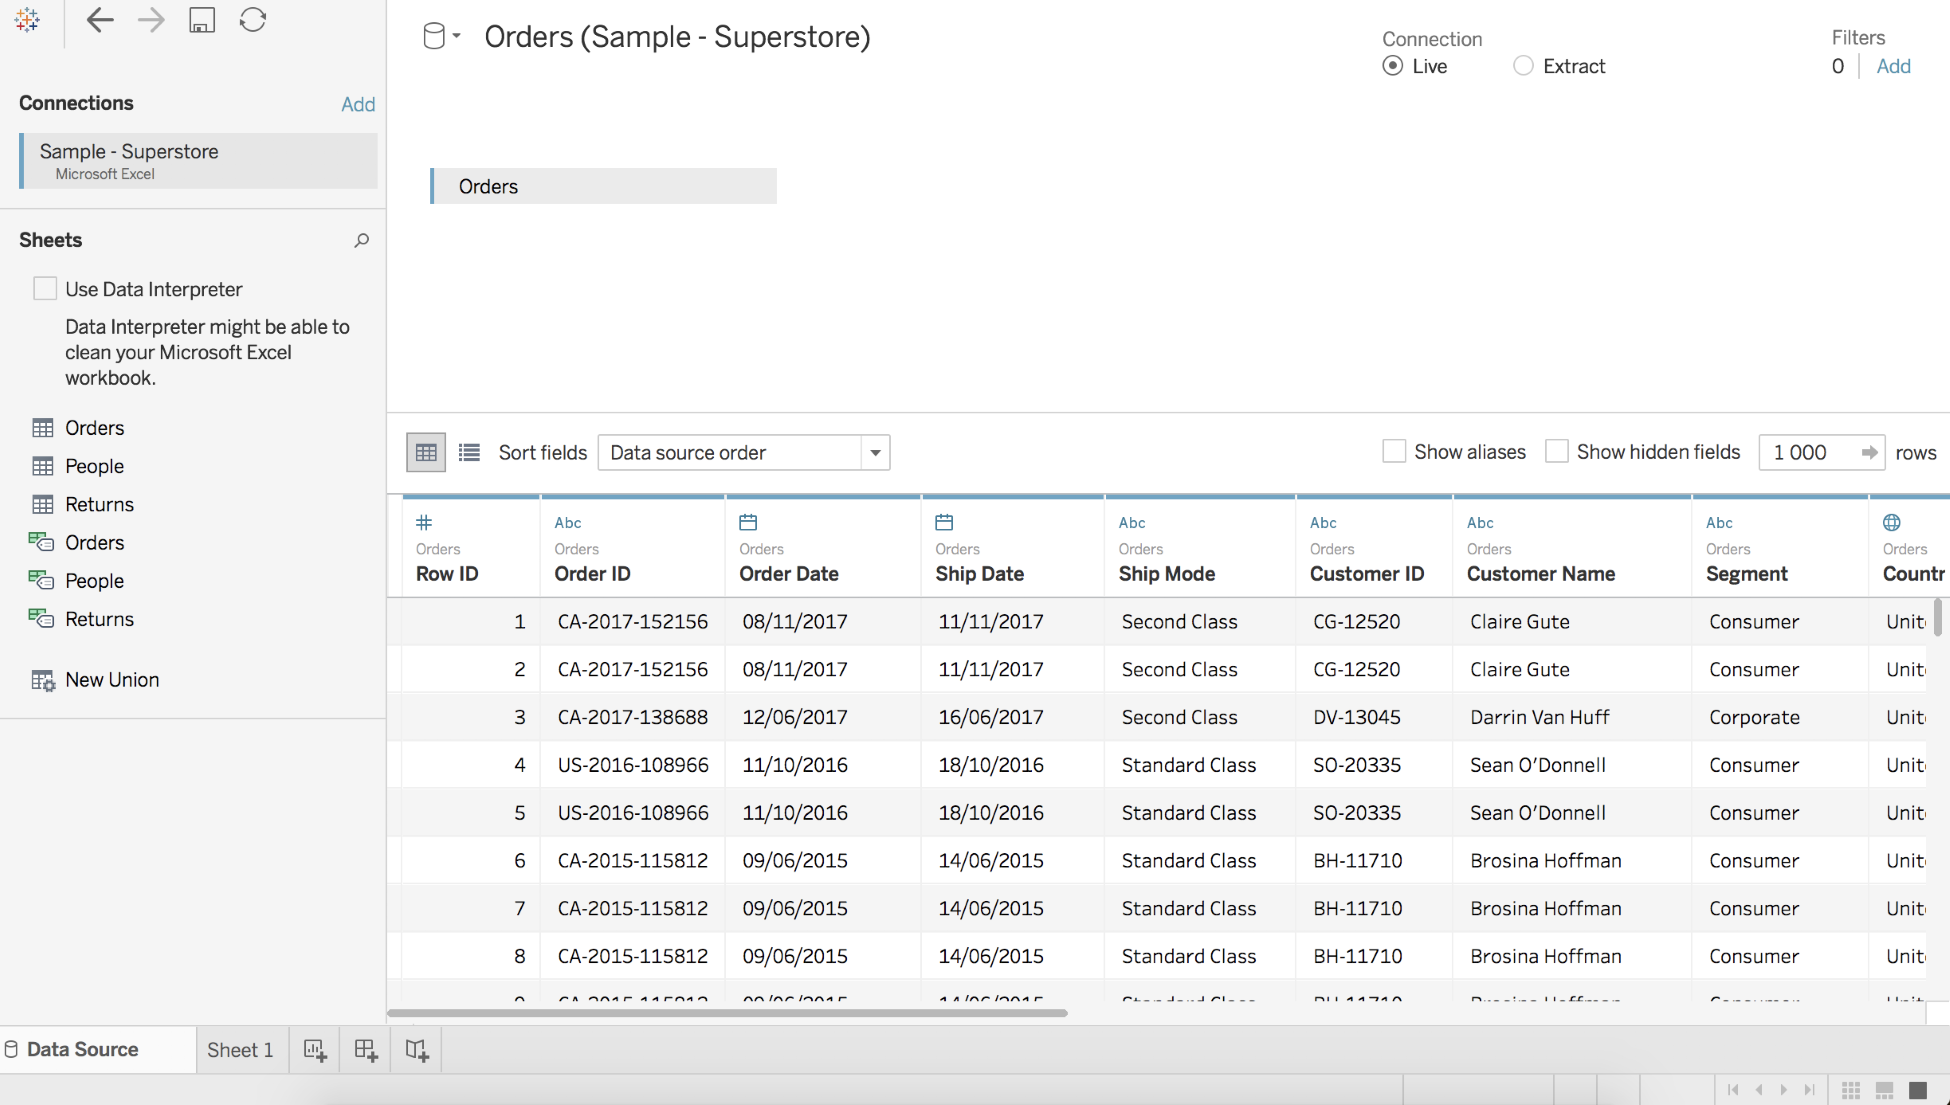
After connecting to a File or a Server, Tableau opens the Data Source workplace. On this page, you can create the Data Source by choosing the tables you want to use and creating Joins, Unions, or other transformations. The following screenshot illustrates the Data Source workplace:

Once your Data Source is done, you can start working on a Worksheet. Sheet 1 is your first Worksheet. On the left you can see your Data Source with all the fields, split between four elements: Measures, Dimensions, Sets, and Parameters. Each field has a data...