Sign In Start Free Trial
Account

Add to playlist

Create a Playlist

Modal Close icon
You need to login to use this feature.
  • Book Overview & Buying SAP Business Intelligence Quick Start Guide
  • Table Of Contents Toc
SAP Business Intelligence Quick Start Guide

SAP Business Intelligence Quick Start Guide

By : Vinay Singh
close
close
SAP Business Intelligence Quick Start Guide

SAP Business Intelligence Quick Start Guide

By: Vinay Singh

Overview of this book

The SAP BusinessObjects Business Intelligence platform is a powerful reporting and analysis tool. This book is the ideal introduction to the SAP BusinessObjects Business Intelligence platform, introducing you to its data visualization, visual analytics, reporting, and dashboarding capabilities. The book starts with an overview of the BI platform and various data sources for reporting. Then, we move on to looking at data visualization, analysis, reporting, and analytics using BusinessObjects Business Intelligence tools. You will learn about the features associated with reporting, scheduling, and distribution and learn how to deploy the platform. Toward the end, you will learn about the strategies and factors that should be considered during deployment. By the end, you will be confident working with the SAP BusinessObjects Business Intelligence platform to deliver better insights for more effective decision making.
Table of Contents (14 chapters)
close
close
Lock Free Chapter
1
Section 1: Introduction to SAP Business Intelligence
3
Section 2: Data Visualization, Analysis, and Reporting
10
Section 3: BI Platform Features and Deployment

Creating a SAP Lumira storyboard

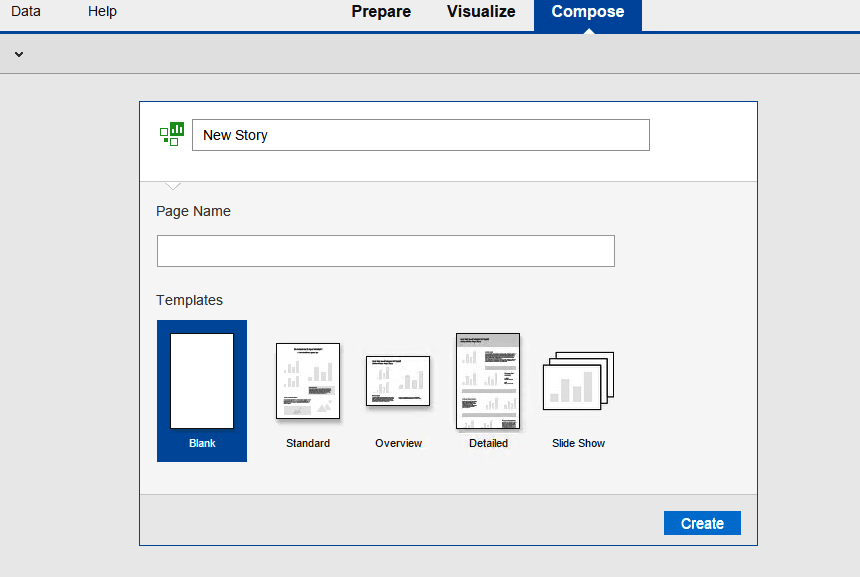
In the previous section, we learned how to create a visualization with various data sources. Now, we can combine these visualization pieces into a storyboard. Let's quickly run through steps of how to create a storyboard:

  1. Launch SAP Lumira and go to Compose:
  1. Open an existing SAP Lumira sample document so that we can design some contest results. Choose Try with samples and double-click it. Here, I will use the same report that we created previously.
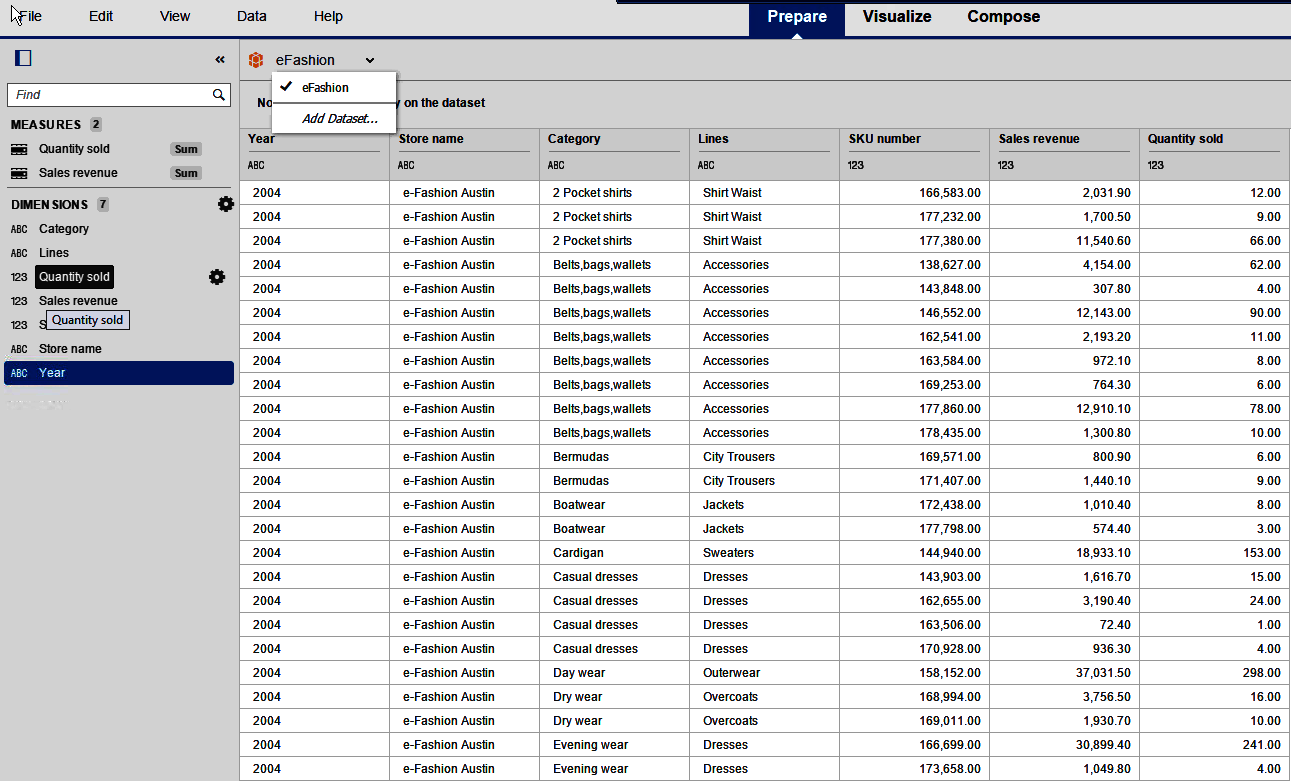
  2. Open the Prepare tab page and determine the source of the data for this document. Choose the Prepare tab page. If you are using the sample document, in the top right, you will see that the source is an Excel document called Results.xlsx. Since we are using a report that we created ourselves, we will see the following screenshot:
  1. To review some of the visualizations that we have, choose the...
CONTINUE READING
83
Tech Concepts
36
Programming languages
73
Tech Tools
Icon Unlimited access to the largest independent learning library in tech of over 8,000 expert-authored tech books and videos.
Icon Innovative learning tools, including AI book assistants, code context explainers, and text-to-speech.
Icon 50+ new titles added per month and exclusive early access to books as they are being written.
SAP Business Intelligence Quick Start Guide
notes
bookmark Notes and Bookmarks search Search in title playlist Add to playlist font-size Font size

Change the font size

margin-width Margin width

Change margin width

day-mode Day/Sepia/Night Modes

Change background colour

Close icon Search
Country selected

Close icon Your notes and bookmarks

Confirmation

Modal Close icon
claim successful

Buy this book with your credits?

Modal Close icon
Are you sure you want to buy this book with one of your credits?
Close
YES, BUY

Submit Your Feedback

Modal Close icon
Modal Close icon
Modal Close icon