Book Image

Mastering Malware Analysis

By : Alexey Kleymenov, Amr Thabet
Book Image

Mastering Malware Analysis

By: Alexey Kleymenov, Amr Thabet

Overview of this book

With the ever-growing proliferation of technology, the risk of encountering malicious code or malware has also increased. Malware analysis has become one of the most trending topics in businesses in recent years due to multiple prominent ransomware attacks. Mastering Malware Analysis explains the universal patterns behind different malicious software types and how to analyze them using a variety of approaches. You will learn how to examine malware code and determine the damage it can possibly cause to your systems to ensure that it won't propagate any further. Moving forward, you will cover all aspects of malware analysis for the Windows platform in detail. Next, you will get to grips with obfuscation and anti-disassembly, anti-debugging, as well as anti-virtual machine techniques. This book will help you deal with modern cross-platform malware. Throughout the course of this book, you will explore real-world examples of static and dynamic malware analysis, unpacking and decrypting, and rootkit detection. Finally, this book will help you strengthen your defenses and prevent malware breaches for IoT devices and mobile platforms. By the end of this book, you will have learned to effectively analyze, investigate, and build innovative solutions to handle any malware incidents.
Table of Contents (18 chapters)
Free Chapter
1
Section 1: Fundamental Theory
3
Section 2: Diving Deep into Windows Malware
5
Unpacking, Decryption, and Deobfuscation
9
Section 3: Examining Cross-Platform Malware
13
Section 4: Looking into IoT and Other Platforms

How to analyze a sample with OllyDbg

OllyDbg UI interface is pretty simple and easy to learn. Here, will cover the steps and the different windows that can help you through your analysis:

  1. Select a sample to debug: You can directly open the sample file from File | Open and choose a PE file to open (it could be a DLL file as well, but make sure it's a 32-bit sample). Or, you can attach to a running process as follows:
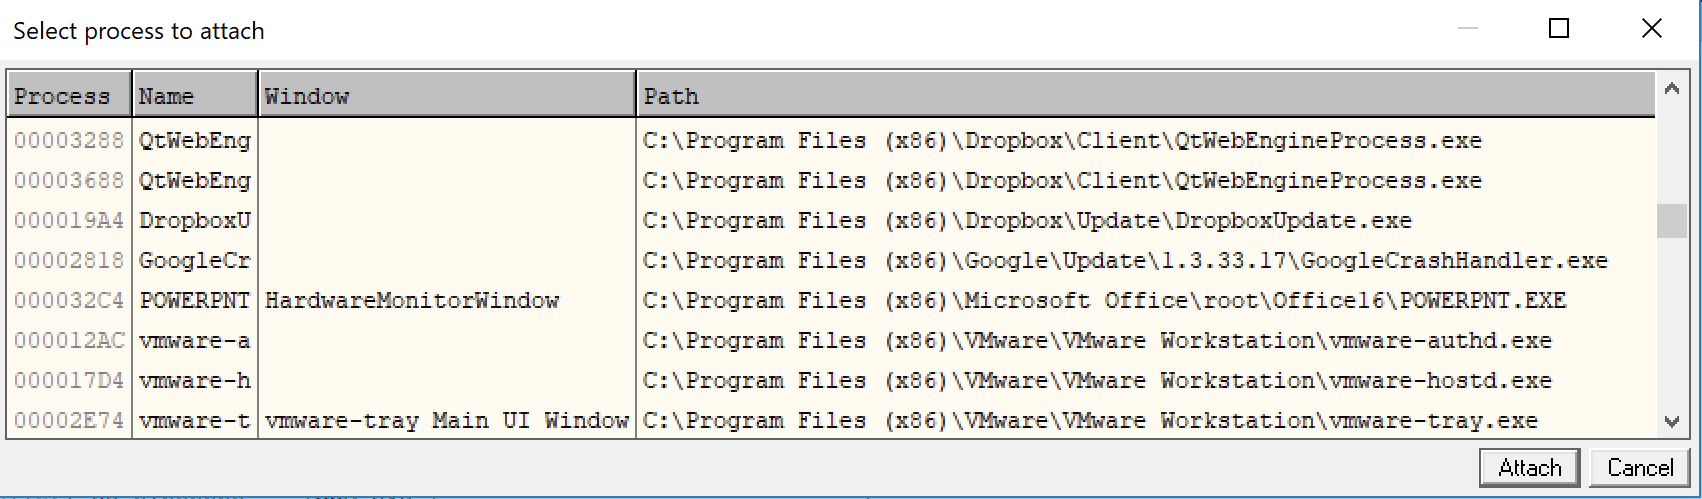
Figure 18: OllyDbg attaching dialog window
  1. CPU window: Your main window: This is the window that you spend most of your debugging time in. This window includes the assembly code on the top-left side and provides an option set breakpoints by double-clicking on the address or modifying the program's assembly code.

You've also got the registers on the top-right side and you have the ability to modify the registers at any given time (if the execution is paused). At the bottom side you have the stack and the data in hex, which you can also modify.

You can simply...