Book Image

Learning SAP Analytics Cloud

Book Image

Learning SAP Analytics Cloud

Overview of this book

The book starts with the basics of SAP Analytics Cloud (formerly known as SAP BusinessObjects Cloud) and exposes almost every significant feature a beginner needs to master. Packed with illustrations and short, essential, to-the-point descriptions, the book provides a unique learning experience. Your journey of exploration starts with a basic introduction to the SAP Analytics Cloud platform. You will then learn about different segments of the product, such as Models, Stories, Digital Boardroom, and so on. Then, you are introduced to the product's interface: the Home screen, the main menu, and more. Then comes the hands-on aspect of the book, which starts with model creation. Next, you learn how to utilize a model to prepare different types of stories(reports) with the help of charts, tables, Geo Maps, and more. In the final chapters of this book, you will learn about Digital Boardroom, Collaboration, and Administration.
Table of Contents (11 chapters)

Applying a date filter

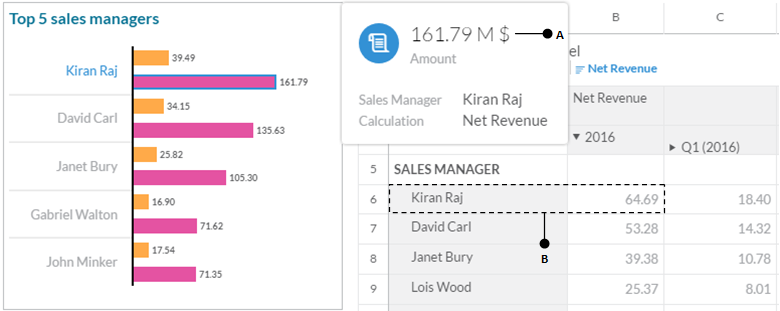
The current status of the page is depicted in the following partial illustration. As you can see, the contribution of Kiran Raj towards net revenue in the chart is showing 161.79 million (A), whereas the table is showing 64.69 million (B) for the same sales manager. This is due to the filter applied on the table data in step 29 to restrict the table results to 2016. Execute the following steps to apply a similar filter to the chart to match the results:

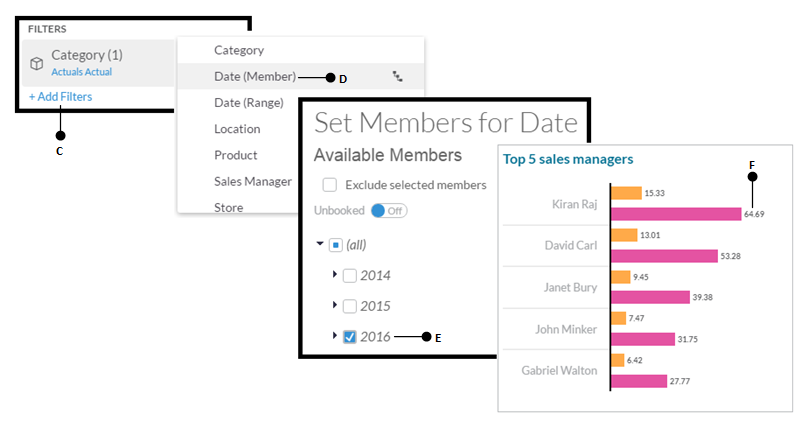
  1. Select the chart, and then click on the Add Filters link (C) located at the bottom of the Builder panel. From the list that pops up carrying the list of dimensions, select Date (Member) (D).

This will show a Set Members for Date window. In this window, select 2016 (E) and click on OK. The chart's figures (F) now match those shown in the table: