Book Image

Learning Tableau 2022 - Fifth Edition

By : Joshua N. Milligan
Book Image

Learning Tableau 2022 - Fifth Edition

By: Joshua N. Milligan

Overview of this book

Learning Tableau 2022 helps you get started with Tableau and data visualization, but it does more than just cover the basic principles. It helps you understand how to analyze and communicate data visually, and articulate data stories using advanced features. This new edition is updated with Tableau’s latest features, such as dashboard extensions, Explain Data, and integration with CRM Analytics (Einstein Analytics), which will help you harness the full potential of artificial intelligence (AI) and predictive modeling in Tableau. After an exploration of the core principles, this book will teach you how to use table and level of detail calculations to extend and alter default visualizations, build interactive dashboards, and master the art of telling stories with data. You’ll learn about visual statistical analytics and create different types of static and animated visualizations and dashboards for rich user experiences. We then move on to interlinking different data sources with Tableau’s Data Model capabilities, along with maps and geospatial visualization. You will further use Tableau Prep Builder’s ability to efficiently clean and structure data. By the end of this book, you will be proficient in implementing the powerful features of Tableau 2022 to improve the business intelligence insights you can extract from your data.
Table of Contents (20 chapters)
18
Other Books You May Enjoy
19
Index

Exploring the Tableau data model

Every data source you create in Tableau will use the data model. Any time you relate two or more sets of data, you’ll need to give some thought as to the various ways you might relate them in the data model. We’ll cover some of the basics of what a data model is and how to create it first.

Creating a data model

We’ve briefly looked at the Data Source screen in Chapter 2, Connecting to Data in Tableau. Now, we’ll take a deeper look at the concepts behind the interface. Feel free to follow along with the following example in the Chapter 14 Starter.twb workbook, or examine the end results in Chapter 14 Complete.twbx.

We’ll start by creating a connection to the Hospital Visits.xlsx file in the Chapter 14 directory. The Data Source screen will look like this upon first connecting to the file:

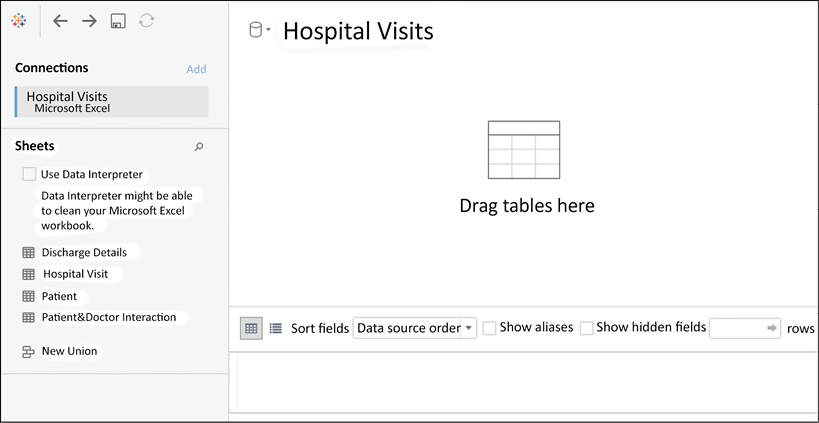
Figure 14.2: The Data Source screen lists the tabs in the Excel workbook and invites you to start a data model...