Book Image

Hands-On Object-Oriented Programming with C#

By : Raihan Taher
Book Image

Hands-On Object-Oriented Programming with C#

By: Raihan Taher

Overview of this book

Object-oriented programming (OOP) is a programming paradigm organized around objects rather than actions, and data rather than logic. With the latest release of C#, you can look forward to new additions that improve object-oriented programming. This book will get you up to speed with OOP in C# in an engaging and interactive way. The book starts off by introducing you to C# language essentials and explaining OOP concepts through simple programs. You will then go on to learn how to use classes, interfacesm and properties to write pure OOP code in your applications. You will broaden your understanding of OOP further as you delve into some of the advanced features of the language, such as using events, delegates, and generics. Next, you will learn the secrets of writing good code by following design patterns and design principles. You'll also understand problem statements with their solutions and learn how to work with databases with the help of ADO.NET. Further on, you'll discover a chapter dedicated to the Git version control system. As you approach the conclusion, you'll be able to work through OOP-specific interview questions and understand how to tackle them. By the end of this book, you will have a good understanding of OOP with C# and be able to take your skills to the next level.
Table of Contents (16 chapters)

Visual Studio as an editor

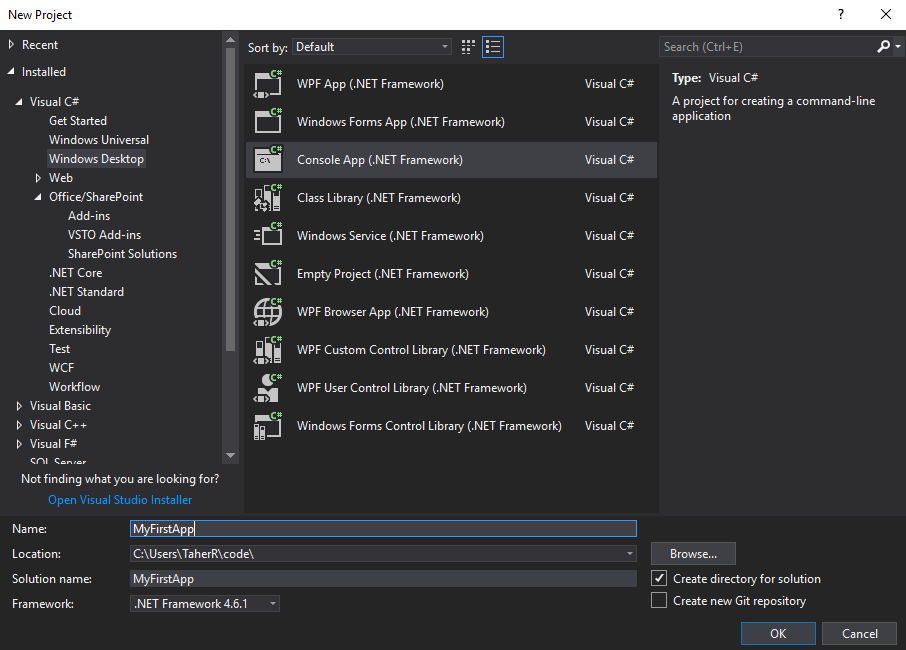
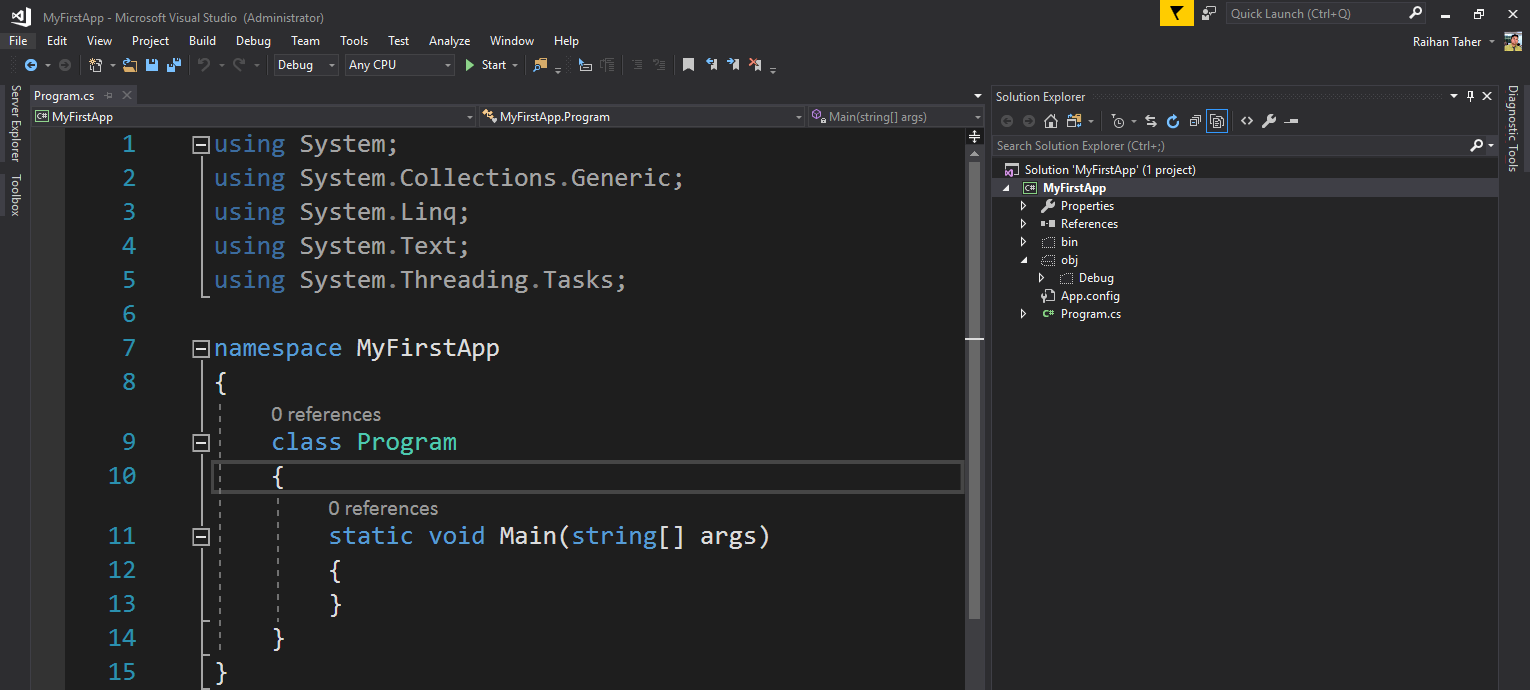
Microsoft has created a number of improvement toolsets that help in creating, debugging, and running programs. One of these tools is called Visual Studio (VS). Microsoft VS is a Development Environment that works with Microsoft languages. It is a tool that developers can rely on so that they can work easily with Microsoft technologies. VS has been around for quite some time, but the new VS has been totally redesigned and was released as VS 2019 to support .NET languages.

Evolution of Visual Studio

As time passed, Microsoft released newer versions of VS with more advantages and enhancements. Being a plugin host that hosts a number of services as plug-in, VS has evolved with a lot of tools and extensions. It has been the core part of every developer's activity. VS has been used by a large number of people who are not a part of the developer community, because they have found this IDE beneficial for editing and managing documents.

Types of Visual Studio

Microsoft has introduced different types or editions of VS. The difference between these editions are features and pricing. Among the editions, one is free, while others you have to buy. Consequently, knowing which edition provides which features and which edition is better for which type of work will make it easier for a developer to choose the edition right.

Let's look at a comparison between all versions of VS.

Visual Studio Community

VS Community edition is the free edition. This edition doesn't have some advanced features that are available in the others, but this Community edition is perfectly fine for building small/mid-sized projects. This is especially useful for a person who wants to explore the C# programming language, since they can download this edition for free and start building applications.

Visual Studio Professional

This version of VS is for your own development, with important debugging tools and all of the commonly used developer tools. So, you can use the IDE as your primary orientation and then you can go ahead!

Visual Studio Enterprise

VS Enterprise edition is for enterprises that require commercial levels of usage of the IDE. It supports special tools for testing, debugging, and so on. It also discovers common coding errors, generates test data, and much more.

Visual Studio Code

VS Code is a small, open source tool that is not a full IDE, but a simple code editor that has been developed by Microsoft. This editor is very lightweight and platform-independent. VS Code doesn't come with most of the features that the VS IDE has, but has sufficient features for developing and debugging an application.

For this book, we are going to use VS Community in most of our cases, but you can install any version that you wish. You can download the Community edition free of cost at the following link: https://www.visualstudio.com/downloads/.

Introduction to the Visual Studio IDE

After you first install VS, the VS installer will give you a few options regarding workloads, which means the type of applications you are going to develop using this IDE. For this book, we will only be creating C# console applications, so you can choose that option if you want. Now, let's start the VS IDE. After loading the IDE, it'll show you a start page with multiple options. Choose the option to create a new project.

New Project

After you choose new project, the New Project dialog box will appear. In this dialog box, a number of options will be available based on the packages that are currently installed with the IDE, as shown in the following screenshot:

In the preceding screenshot, the left-hand side groups are the types of templates that you can choose from. Here, I have chosen Windows Desktop and, from the middle window, I have selected Console App (.NET framework) to create my application. The bottom of the screen allows you to name the project and choose the location to store the project files. There are two checkboxes available, one of which says Create directory for solution when selected (by default, this remains selected). This creates a directory below the chosen path and places the files inside it, otherwise it will create files just inside the folder.

Use Search Installed Template to search for any template by its name at the right corner of the dialog box if you do not find your template. Since more than one framework can exist in one PC, the New Project dialog will allow you to choose a framework; you need to use this while deploying the application. It shows .NET framework 4.6.1 by default as the framework for the project, but you can change to any framework by selecting one from the drop-down menu.

Finally, click OK to create the project with the default files:

The preceding screenshot shows what a basic IDE looks like after the project is created. We can also see each section of IDE. The main IDE is composed of many tool windows. You can see some tool windows on all sides of the screen. The Task List window is at the bottom of the screen. The main IDE workspace is in the middle and forms the working area of the IDE. The workspace can be zoomed into by using the Zoom control in the corner of the screen. The IDE search box at the top of the screen gives you insight into finding options inside the IDE more elegantly and easily. We will now divide the whole IDE into those parts and explore the IDE.

Solution Explorer

The folders and files are hierarchically depicted in the Solution Explorer. Solution Explorer is the main window and lists the entire solution that is loaded to the IDE. This gives you a view of projects and files that have a solution for easy navigation in the form of a tree. The outer node of the Solution Explorer is itself a solution, then the projects, and then the files and folders. The Solution Explorer supports loading folders inside the solution and storing documents in the first level, too. The project that is set as startup is marked in bold.

There are many buttons present at the top of the Solution Explorer called toolbar buttons. Based on the file that's selected in the tree, the toolbar buttons will be enabled or disabled. Let's look at each of them individually:

  • Collapse All button: This button allows you to collapse all of the nodes below the node that's currently selected. While working with a big solution, it is often necessary to collapse a portion of the tree completely. You can use this feature without collapsing each node manually.
  • Properties: As a shortcut to the Properties window, you can select this button to open the Properties window and load the metadata associated with the currently selected node.
  • Show all files: A solution is generally mapped to a Folder structure on a directory in the filesystem. The files that are included in the solution are only shown on the Solution tree. Showing all files allows you to toggle between viewing all files in the directory and only the files that have been added to the solution.
  • Refresh: This refreshes the state of files in the current solution. The Refresh button also checks every file from the filesystem and shows its status accordingly (if any).
  • View Class Diagram: The class diagram is the logical tree of namespaces and classes rather than the files in the filesystem. When you select this option, VS launches the class diagram with all of the details of its properties, methods, and so on. The class diagram is useful for viewing all of the classes and their associations individually.
  • View Code: When you select a code file, the View Code button appears, which loads the code file associated with the current selection. For instance, when you select a Windows Form, it will show its code behind where the code needs to be written.
  • View Designer: Sometimes, based on the file type that is selected in the tree, the View Designer button appears. This button launches the Designer associated with the currently selected file type.
  • Add New Folder: As I have already stated, a solution can also contain folders. You can add folders directly to the solution by using the Add New Folder button.
  • Create New Solution: Sometimes, when working with large projects, you might need to create a subset of the entire solution and list only the items that you are currently working on. This button will create a separate Solution Explorer that is in sync with the original Solution Explorer, but projects a specific portion of the solution tree.

The solution tree in VS also loads the class structure of the project in the way it is organized in the filesystem. If you see a collapsed folder, you can expand it to see what is inside it. If you expand a .cs file, all of the members of that class are listed. If you just want to see how the classes are organized, you can use the class view window, but by using the Solution Explorer, you can see the classes, as well as the other elements inside its own hierarchy. You can open the Class View by choosing View | ClassView or pressing Ctrl + W and C, so that you can view only a portion of the class and its members:

Some files are shown in the solution as blank files (in our case, folders such as bin and obj). This means that these files exist in the filesystem but are not included in the solution file.

Each file shows additional information on the right-hand side of the tree node in the solution. This button gives extra information that's associated with the file. For instance, if you click on the button corresponding to a .cs file, it will open a menu with Contains. This will get the associated class view for that particular file in the solution. The menu can be pretty long, depending on the items that cannot be shown in the generalized toolbar buttons. When the solution loads additional information, there are forward and backward buttons, which can be used to navigate between views on the solution.

Main workspace area

The main workspace area is where you will actually write your code or apply different settings to your application. This section will open different kinds of files that you have in your project. This is the area which, as a developer, you will spend most of your time coding. You can open multiple files in this window. Different files will be shown in different tabs and you can switch from one tab to another just by clicking on the tab. If you need to, you can also pin tabs. You can make the tabs float if you think you need them that way, or you can also make it full-screen size so that you can focus on the code you are working on.

So, when you double-click on files in the Solution Explorer or choose Open from the context menu of the file, that file is opened in a tab in the main editor area. This way, you can open multiple files in separate tabs in the editor window and switch between them when needed. Each tab header contains a few fixed sets of items:

In the preceding screenshot, you can see that the tab header contains the name of the file (Program.cs) that links to the tab; it shows a * when the item needs to be saved, and it has a Toggle pinner button (just like all other IDE tool windows), which makes the tab sticky on the left side, and a close button. The title section also sometimes indicates some additional status, for example, when the file is locked, it shows a lock icon, and when the object is loaded from metadata, it shows that in square brackets, as in the preceding screenshot. In this section, as we keep on opening files, it goes in a stack of tab pages, one after another, until it reaches the end. After the whole area is occupied, it finally creates a menu on the rightmost corner of the workspace title to hold a list of all of the files that cannot be shown on the screen. From this menu, you can choose which file you need to open. Ctrl + Tab can also be used to toggle between the tabs that are already loaded in the workspace.

Below the title of the tab and before the main workable area are two drop-down menus. One has been loaded with the class that is opened in the IDE, and the right one loads all of the members that are created on the file. These drop-downs menu aid in easier navigation in the file by listing all of the classes that are loaded in the current file on the left, while on the right there is another that contextually lists all of the members that are there in the class. These two drop-downs menu are smart enough to update the drop-down values automatically whenever any new code is added to the editor.

The main workspace area is bounded by two scrollbars, which handle the overflow of the document. However, after the vertical scrollbar, there is a special button to split the window, as shown in the following screenshot:

The horizontal scrollbar, on the other hand, holds another drop-down menu that shows the current zoom percentage of the Editor. VS now allows you to scale your editor to your preferred zoom level. The shortcut for the Zoom feature is Ctrl + scroll mouse wheel.

Output window

The output window is placed on the bottom of the IDE (in general) and it opens up at various times when you either compile, connect to various services, start debugging, or do something that requires the IDE to show some code. The Output window is used by the IDE to display log and trace messages:

The Output window is docked on the bottom of the page, which lists various types of output. From the drop-down menu at the top, you can select which output you want to see in the output window. You will also have the option to clear the log if you want to display only the newer logs.

The Command and Immediate windows

The Command window is very similar to Command Prompt of the Windows operating system. You can execute commands using this tool. In the VS command line, you can execute commands on the project you are working on in. Commands are very handy and increase your productivity as you don't have to drag your mouse around to execute something. You can run a command to make this happen easily.

To open a Command window in VS, you can click on the View menu and then Windows. After this, select Command Window. Alternatively, you can use the keyboard shortcut, Ctrl + Alt + A, to open it. When you are in the Command window, you will see a > placed in front of every input. This is called a prompt. In the prompt, when you start typing, it will show an Intellisense menu for you. Start typing Build.Compile, at which point the project will be compiled for you as well. You can also use Debug.Start to start debugging the application. You can debug your application easily using commands. I will list some of the important commands that are used most often when debugging using the Command window:

  • ?: Tells you the value of a variable (you can also use Debug.Print to do the same)
  • ??: Sends the variable to the watch window
  • locals: Shows the locals window
  • autos: Shows the autos window
  • GotoLn: Sets the cursor to a specific line
  • Bp: Puts a breakpoint in the current line

Similar to the Command window, an Intermediate window lets you test code without having to run it. An Intermediate window is used to evaluate, execute a statement, or even print variable values. To open the Immediate window, go to Debug | Windows and select Immediate.

Search option in IDE

On the very top-right corner of the screen, you will find a new Search box. This is called the IDE search box. VS IDE is vast. There are thousands of options available inside of it that you can configure. Sometimes, it is hard to find a specific option that you want. The IDE search feature helps you find this option easier:

The search option will list all of the entries related to VS IDE options, and you can easily find any feature you are looking for here.