

Creating a bar graph line
We will create a graph line using the Pen tool to indicate the graph values from 2020 to 2026. The Pen tool is a great tool for creating custom shapes and Bezier paths.
Follow these steps to create the bar graph line:
- Select the Pen tool in the Tools panel and make sure Fill is set to None, Stroke is a white color, and the Stroke value is
10.

Figure 4.38: Pen tool settings
- Now, make sure that no layer is selected in the Composition panel, then click on the bottom of the 2020 bar. We create a vertex point on the 2020 bar and place vertex points on all the years’ bars going from top to bottom and again from bottom to top. This depicts that the graph is sometimes going up and sometimes down, which is how a statistical graph naturally is. This is shown in Figure 4.39. Rename the layer
Graph Line.
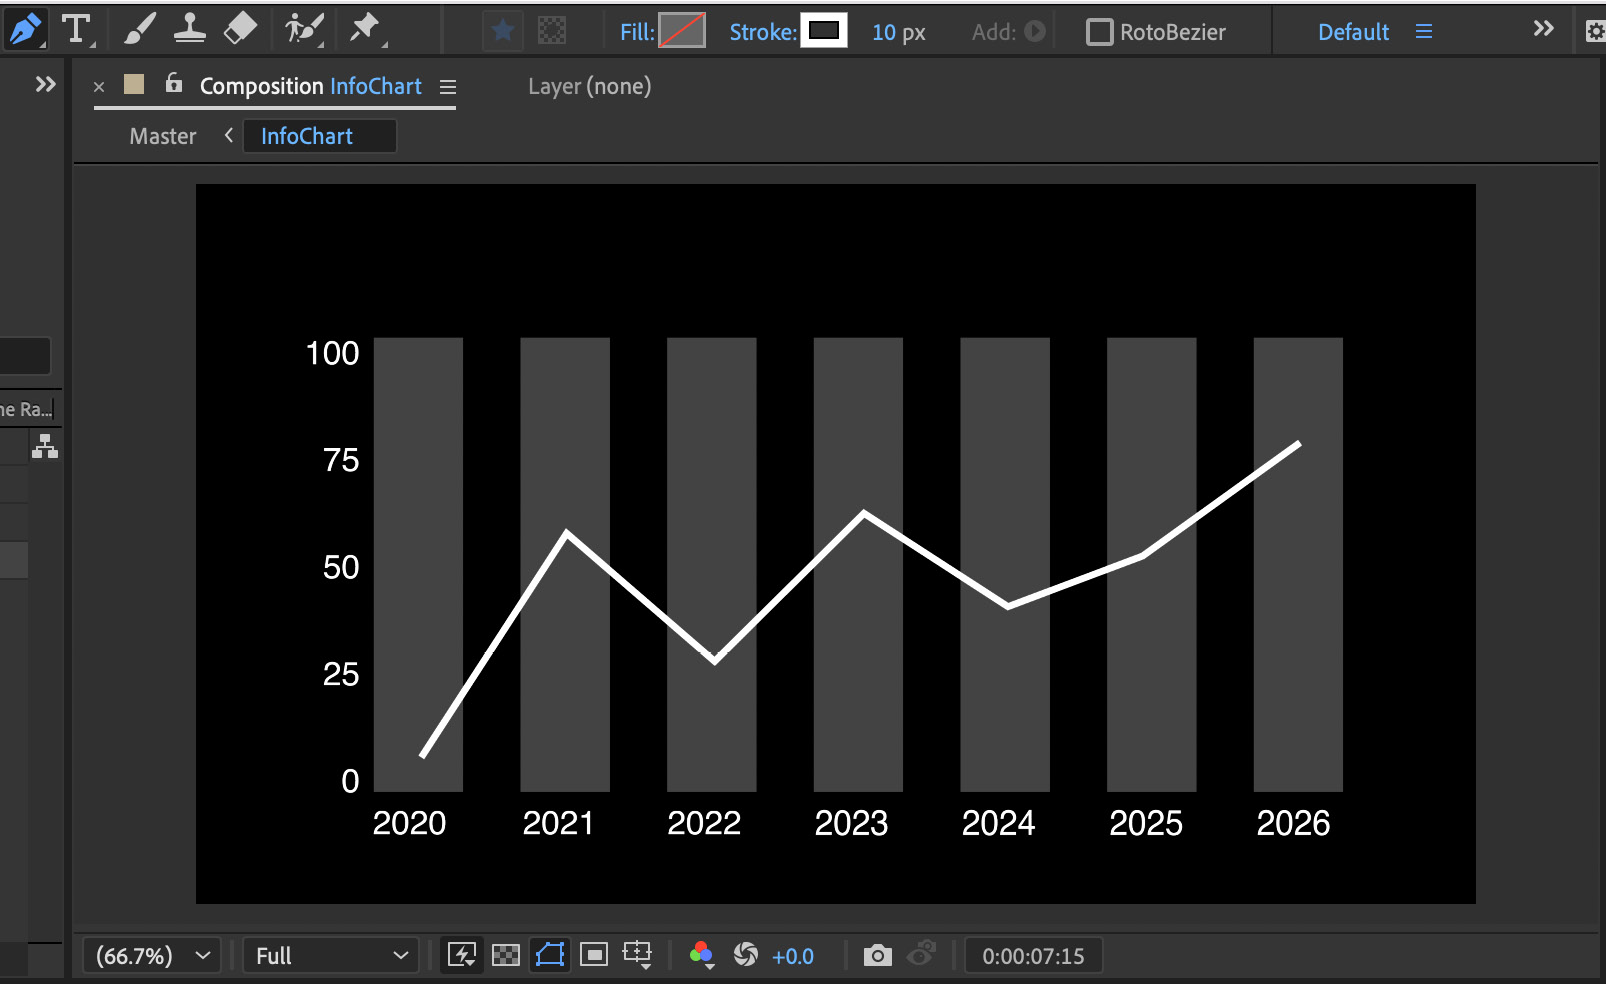
Figure 4.39: Graph Line created using the Pen tool
- Go to the Elliptical...