Book Image

Microsoft 365 and SharePoint Online Cookbook - Second Edition

By : Gaurav Mahajan, Sudeep Ghatak, Nate Chamberlain, Scott Brewster
Book Image

Microsoft 365 and SharePoint Online Cookbook - Second Edition

By: Gaurav Mahajan, Sudeep Ghatak, Nate Chamberlain, Scott Brewster

Overview of this book

Microsoft 365 offers tools for content management, communication, process automation, and report creation. Microsoft 365 and SharePoint Online Cookbook maximizes workplace collaboration and productivity using SharePoint Online, Teams, OneDrive, Delve, M365 Search, Copilot, Power Platform, Viva, Planner, and Microsoft Forms. You will find thoroughly updated recipes for SharePoint Online, covering sites, lists, libraries, pages, web parts, and learn SharePoint Framework (SPFx) basics for building solutions. You will explore many Microsoft Teams recipes to prepare it to be your organization’s central collaboration hub. You will be able to unlock Power Platform potential with recipes for Power Apps to enable low-code/no-code app development and learn to automate tasks with Power Automate and Power Automate Desktop. The book teaches you data visualization with Power BI, and chatbot creation with Power Virtual Agents (Copilot Studio). Finally, you will also learn about the cutting-edge Copilot and Gen AI functionality in Microsoft 365 and Power Platform. By the end, you will be equipped with skills to effectively use Microsoft 365, SharePoint Online, and the Power Platform. Whether it's enhancing career prospects or improving business operations, this book is a perfect companion on your journey through the Microsoft Office 365 suite.
Table of Contents (15 chapters)
13
Other Books You May Enjoy
14
Index

Visualizing data

The end goal of any data-crunching exercise is to draw insights from your data. Power BI visualizations provide you with hundreds of visuals (some within Power BI Desktop; others from the marketplace). A Power BI report might consist of a single visual on the entire page, or it might have pages full of visuals.

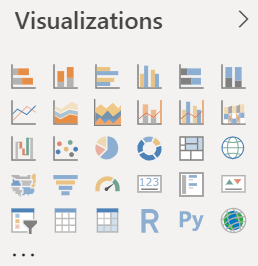
There are many different visual types available directly from the Power BI Visualizations pane:

Figure 29: Visualization available with Power BI Desktop

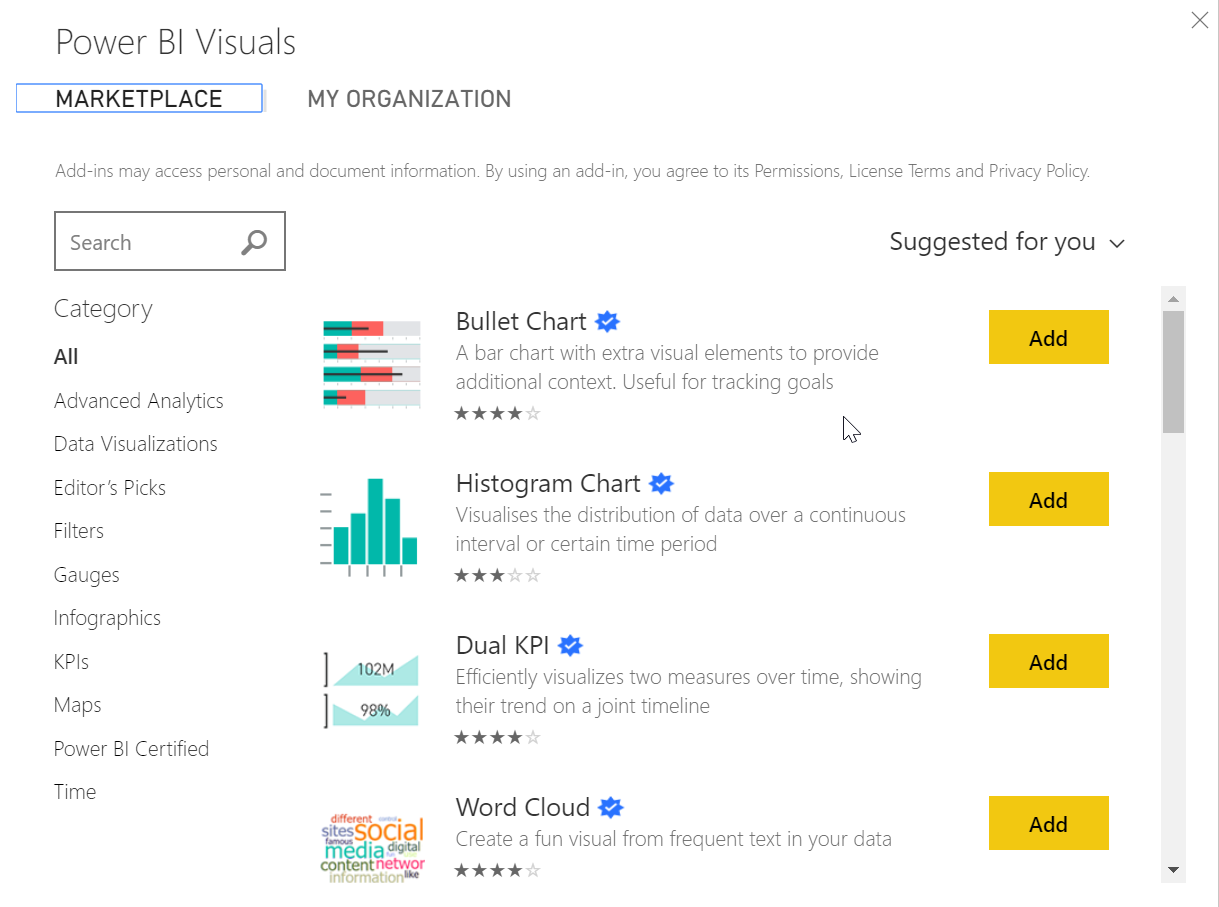
And, for even more choices, visit the MARKETPLACE:

Figure 30: Getting visualizations from Marketplace

There is an upper limit to the number of fields you can add to any visual. The limit is 100 fields (including measures or columns). If your visual fails to load, try reducing the number of fields in your visualization.

Getting ready

A user can interact with the visual either as a designer or as a consumer.

A designer can add/edit or change visuals using Power BI Desktop. A consumer, on the other hand, can...