Book Image

Building Dynamics CRM 2015 Dashboards with Power BI

By : Steve Ivie
Book Image

Building Dynamics CRM 2015 Dashboards with Power BI

By: Steve Ivie

Overview of this book

<p>Dynamics CRM 2015 holds a wealth of information about customers and the sales pipeline, but sometimes leaves users with basic end-user reporting and dashboard options. Power BI is a great new tool for analyzing and presenting data, giving us the ability to dig deeper into the information. With the increased requests for real-time sales analytics, Power BI when connected to Dynamics CRM offers a self-service approach to build, shape, and present data through an easy-to-use interface. The set of features within Power BI will give all users a tool to generate real-time sales productivity reports and dashboards to enhance their sales performance.</p> <p>This book will provide you with the skills you need to learn how to build and present Dynamics CRM 2015 sales dashboards using Power BI. It follows a step-by-step process to build an interactive dashboard by organizing and consolidating datasets, improving the look and feel of graphs, charts, and maps, and enhancing data clarity with filters and slicers.</p> <p>By sequentially working through the steps in each chapter, you will learn how to use the Power BI Q/A functionality to query data in the dashboard, extend the dashboards to the mobile apps for the iPad and Surface, and leverage the pre-built workbook template provided by Microsoft for Dynamic CRM 2015 sales, service, and marketing dashboards.</p>
Table of Contents (18 chapters)
Building Dynamics CRM 2015 Dashboards with Power BI
Credits
About the Author
About the Reviewers
www.PacktPub.com
Preface
Index

Installing the Power BI Designer


Power BI along with PowerQuery, PowerMap, and PowerView—used to be only included as a Microsoft Excel 2013 add-in. Although these add-ins are still available, there is now a new tool dedicated to Power BI report and dashboard authoring called Power BI Designer.

The Power BI Designer offers a lot of the same functionalities as its predecessor in Excel add-in, but without the Excel requirements. The benefit of using the Power BI Designer is that it is a standalone program that can provide self-service data connectivity, transformation, modeling, visualizations, and collaboration. The Power BI Designer is a standalone 64-bit application that can be deployed together with a 32-bit version of Office, using the same functionality that was used to create interactive charts, maps, graphs, and data transformations without the requirement of Microsoft Excel 2013.

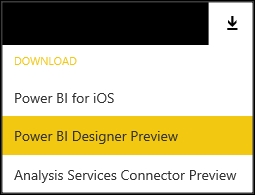
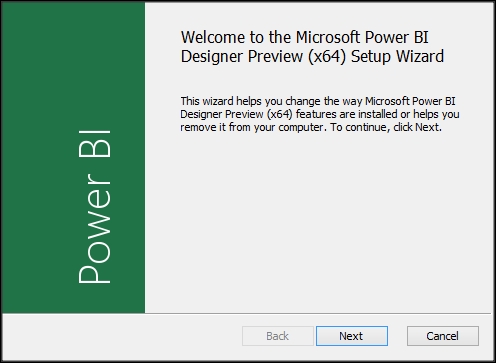
Here is how you install it:

  1. In the Power BI site, navigate to the down arrow icon located in the top-right corner of the navigation area:

  2. Download Power BI Designer Preview.

  3. Then, install the PBIDesignr_x64.msi file.

  4. Open Power BI Designer from the desktop icon:

Now that you have Power BI Designer installed and open, you can begin leveraging the tool for dashboard, report creation, and data transformation. Power BI Designer help videos are available at startup or by navigating to File -> Getting Started in the main menu.

The Power BI Designer toolset is based on two views:

  • Query: This connects, shapes, and combines data to data models

  • Report: This builds reports from the queried information to shareable reports

    Power BI Designer preview

Once you build your dashboards and reports with Power BI Designer, you will want to save your work. Using Power BI Designer, you can now save it as a Power BI Designer file. Later in Chapter 7, Deploy and Present Reports to the Power BI Site, you will learn how to save the designer file and upload it to the Power BI site.