

You can build reports using either the Power BI Designer or Power BI for the Office 365 site. In this chapter, we will build the reports with the Power BI Designer and then in Chapter 6, Adding ERP Data, we will import and modify the reports using Power BI for Office 365 sites.
Tip
If you have ever used Microsoft Excel with Power View, the Power BI Designer and Power BI for Office 365 work the same way; the reports will be presented in the left-hand side pane and the individual datasets will be presented in the right-hand side pane.
Building a report with the Power BI Designer is fairly simple. Starting with a blank report canvas, we will add all the data visualizations with a drag and drop method from the datasets fields located on the left-hand side of the Power BI Designer window. We will build each visualization on its own report for clarity purposes.
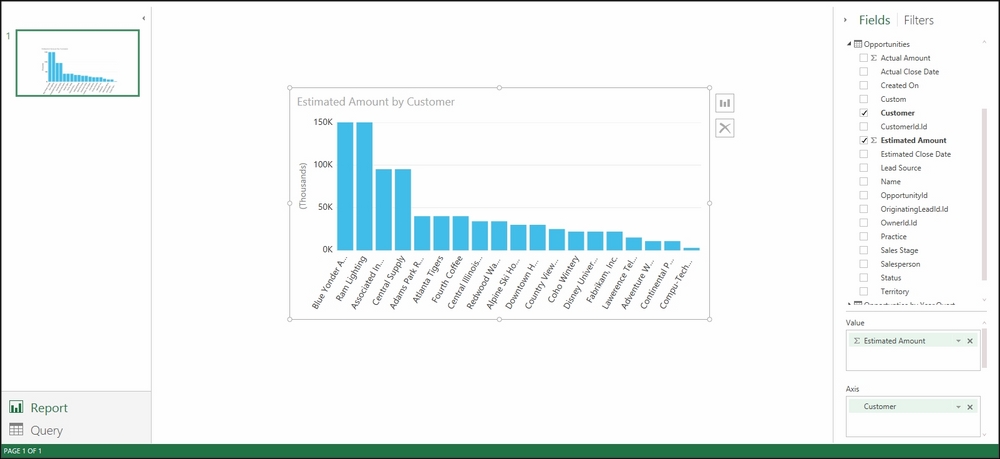
Bar graph Estimated Amount by Customer
Most of these reports will be built using the Opportunities dataset, but we will also...