

Most of the time, users want to see their summary sales data in individual sales revenue buckets that follow some sort of sales process. An example of this would be to group the sum of multiple rows into one row based on territory and product. The Power BI Designer gives us the tools to do just that.
Here is how it is done:
From the main ribbon on the main Power BI query window, you can group any combination of rows in a dataset. For this book, we will focus on a combination of groupings for territory and product to get summarized data for the sales productivity reports and dashboards.
Here is what we need to do to group a dataset:
First, we will address Group by Territory and Product. In the Group by Territory and Product dataset, navigate to the home ribbon tab in the Power BI Designer and select Group By under the Transform tab:
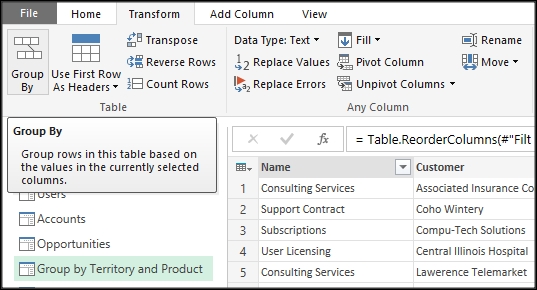
Once the Group By window appears, use the + or - sign to add the columns you want to group by. Use the Name, Territory, and Status columns for this summary...