

Usually, seeing your sales data in the flat format is all you need to be productive. Out of the box, Power BI provides a basic card visualization option, which does just what it says. For a majority of salespersons, it is a very effective way to just see your data.
For our sales productivity dashboard, we need to display Estimated Revenue and Customer with Number of Days the Deal is Open in a single card. Adding customer revenue cards can help sales see a simple view of the top customer and potential sales to help with most important deals:
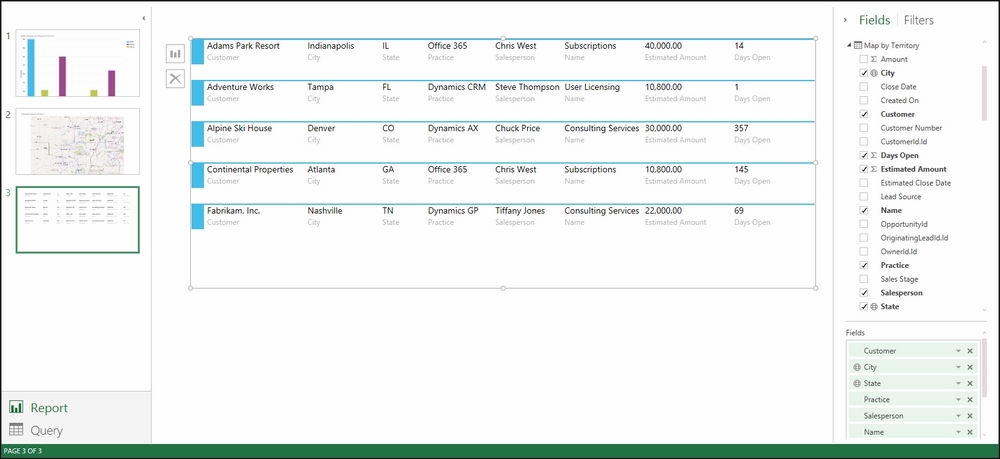
Customer Card with Number of Days Deal is Open
To get started, we need to add a new report with a Card type to show customer cards with the sales pipeline information with Days Open.
Here is how it is done:
Add a new page to your report for Cards, navigate to the top main menu, and select New Page.
Navigate to the Fields and Filters area on the left-hand side of the form window and select City, State, Customer, Days Open, Name, Salesperson, Practice...