Book Image

Building Dynamics CRM 2015 Dashboards with Power BI

By : Steve Ivie
Book Image

Building Dynamics CRM 2015 Dashboards with Power BI

By: Steve Ivie

Overview of this book

<p>Dynamics CRM 2015 holds a wealth of information about customers and the sales pipeline, but sometimes leaves users with basic end-user reporting and dashboard options. Power BI is a great new tool for analyzing and presenting data, giving us the ability to dig deeper into the information. With the increased requests for real-time sales analytics, Power BI when connected to Dynamics CRM offers a self-service approach to build, shape, and present data through an easy-to-use interface. The set of features within Power BI will give all users a tool to generate real-time sales productivity reports and dashboards to enhance their sales performance.</p> <p>This book will provide you with the skills you need to learn how to build and present Dynamics CRM 2015 sales dashboards using Power BI. It follows a step-by-step process to build an interactive dashboard by organizing and consolidating datasets, improving the look and feel of graphs, charts, and maps, and enhancing data clarity with filters and slicers.</p> <p>By sequentially working through the steps in each chapter, you will learn how to use the Power BI Q/A functionality to query data in the dashboard, extend the dashboards to the mobile apps for the iPad and Surface, and leverage the pre-built workbook template provided by Microsoft for Dynamic CRM 2015 sales, service, and marketing dashboards.</p>
Table of Contents (18 chapters)
Building Dynamics CRM 2015 Dashboards with Power BI
Credits
About the Author
About the Reviewers
www.PacktPub.com
Preface
Index

Putting it all together


Viewing each chart, cards, and map on a separate report page may make it easier to design, update, and/or troubleshoot your charts, maps, and/or tables, but at some point, we may want to have a single page with everything on it. This is as simple as copy and paste.

In Chapter 6, Adding ERP Data, when we upload these reports to the Power BI for the Office 365 site, every report page will be loaded. So, either way, all the charts, maps, cards, and tables will be available for a user to view:

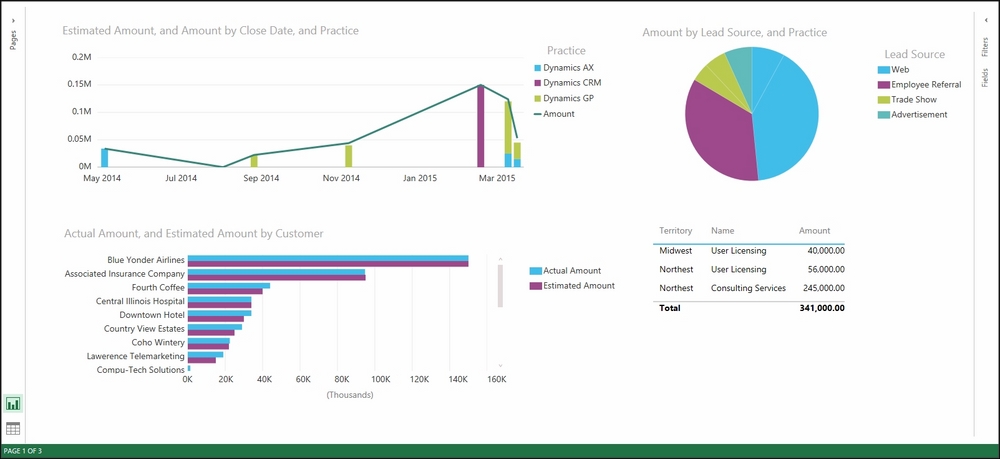
All reports together in the Sales Productivity Report

If you do want to add all the seven charts and maps to one or two report pages, it is as simple as copy and paste; here is a simple example of how to do it:

  1. Select a report page and individual chart, map, or table.

  2. Use Ctl+C to copy the chart, map, or table.

  3. Use Ctl+V on the new report page to paste the chart, map, or table.

  4. To resize each chart, select and drag any side or corner of the chart area.

To add another report page for all...