Book Image

ExtGWT Rich Internet Application Cookbook

By : Odili Charles Opute , Oded Nissan
Book Image

ExtGWT Rich Internet Application Cookbook

By: Odili Charles Opute , Oded Nissan

Overview of this book

<p>Get ready to build the next generation Gmail, Facebook, or Meebo, with HTML5 and Server Push, taking advantage of the power and versatility of Java with ExtGWT. Sencha Ext GWT takes GWT to the next level, giving you high-performance widgets, feature-rich templates and layouts, advanced charting, data loaders and stores,&nbsp; accessibility, and much more.<br /><br /><i>ExtGWT Rich Internet Application Cookbook will teach you to quickly build&nbsp; stunning functionality into your own apps with ExtGWT</i>.<br /><br />This is a catalog of practical solutions to get your ExtGWT web app up and running in no time, with tips for persistence and best practices. You begin by playing with panels, windows, and tabs, to learn the essentials. Next, you engage yourself with forms, buttons, toolbars and menus to build on further. Dealing with the UI and the trees will follow to help you make stunning user interfaces. Then you will be taught to work with Listview, Views, and Gridpanels, the more complex problems. The book will then deal with charts, visualization, and drag and drop to take you to the next level. Finally, you will wind up with serialization, persistence, and custom theming. Now, you are an expert!</p>
Table of Contents (22 chapters)
ExtGWT Rich Internet Application Cookbook
Credits
About the Authors
About the Reviewers
www.PacktPub.com
Preface
Event Handling — Making Those GUIs Do Something
Jakarta Commons-FileUpload

Using a line chart


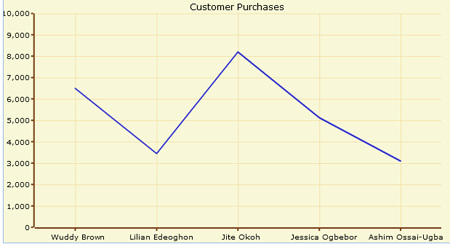
The line chart is a simple yet very useful visualization that draws a line across the calibrated points of intersection on both axes such that it becomes easier for one to see a sequence or path flow for the data. It is mostly used to show the occurrence of data over time but it can be well suited for other purposes.

How to do it...

Create a Chart object with the correct path to the open-flash-chart.swf file, then create a ChartModel and a LineChart configuration object. A XAxis and then a YAxis object configured with an appropriate range need to be set on ChartModel using the setXAxis() and setYAxis() method respectively. Once the model is set on the chart with the chart's setChartModel() and the chart rendered onscreen with a LayoutContainer, we can then add a line when the data is ready by invoking lineChart.addValues() while not forgetting to set up reasonable labels on the x axis using xAxis.addLabels().

@Override
public void onApply() {
// create the Chart object...